Maximum drawdown is the largest observed decline from a portfolio peak to a later trough over a defined period.
It shows how deep the worst peak-to-trough loss was before the portfolio recovered, reached a new high, or the measurement period ended. For investors, the number is useful because it translates downside experience into a percentage that can be compared across portfolios, strategies, or time periods.
Maximum drawdown is historical and period-dependent. It describes what happened inside the selected data window; it does not forecast the next decline or prove that a portfolio is safe.
Maximum Drawdown Definition
Maximum drawdown measures the largest percentage loss from a prior peak value to the lowest later trough before a new peak or recovery reference. A portfolio that rises to $100,000 and later falls to $85,000 has a 15% maximum drawdown for that peak-to-trough episode.
Key Points
- Maximum drawdown measures the worst observed peak-to-trough decline in a selected period.
- The formula can be shown as a negative return or as a positive loss percentage.
- The metric helps investors understand downside experience, not future return potential.
- Two portfolios can have the same return but very different maximum drawdowns.
- Weights, overlap, concentration, rebalancing behavior, time horizon, and risk capacity all change how the number should be interpreted.
What Is Maximum Drawdown?
Maximum drawdown is a portfolio risk metric. It looks backward through a chosen period and identifies the deepest fall from a high point to a lower point that came after it.
The word “maximum” matters because a portfolio may experience many declines. Ordinary drawdown can refer to any peak-to-trough decline, while maximum drawdown refers to the largest one inside the measured period.
The metric is most useful when the period is clearly defined. A one-year maximum drawdown, a five-year maximum drawdown, and a full-cycle maximum drawdown can give very different impressions of the same portfolio.
Maximum Drawdown Formula
Maximum drawdown is usually calculated by comparing the portfolio peak with the lowest later trough.
Negative return format: (Trough value – Peak value) / Peak value
Positive loss format: (Peak value – Trough value) / Peak value
The negative return format shows the decline as a negative percentage. The positive loss format shows the same decline as a positive drawdown percentage. Both formats describe the same peak-to-trough loss, but the sign convention should be clear before comparing numbers.
How to Calculate Maximum Drawdown
Calculation starts with a defined measurement period. Within that period, the investor tracks each new portfolio high, then looks for the lowest later value before a recovery or new high changes the reference point.
- Choose the measurement period.
- Identify each rolling portfolio peak inside that period.
- Find the lowest trough that occurs after each peak.
- Calculate the percentage decline from each peak to its later trough.
- Select the largest decline as the maximum drawdown.
The result changes when the measurement period changes. A period that excludes a severe market decline can make a portfolio look more stable than a longer period would show.
Maximum Drawdown Example: Portfolio Peak and Trough
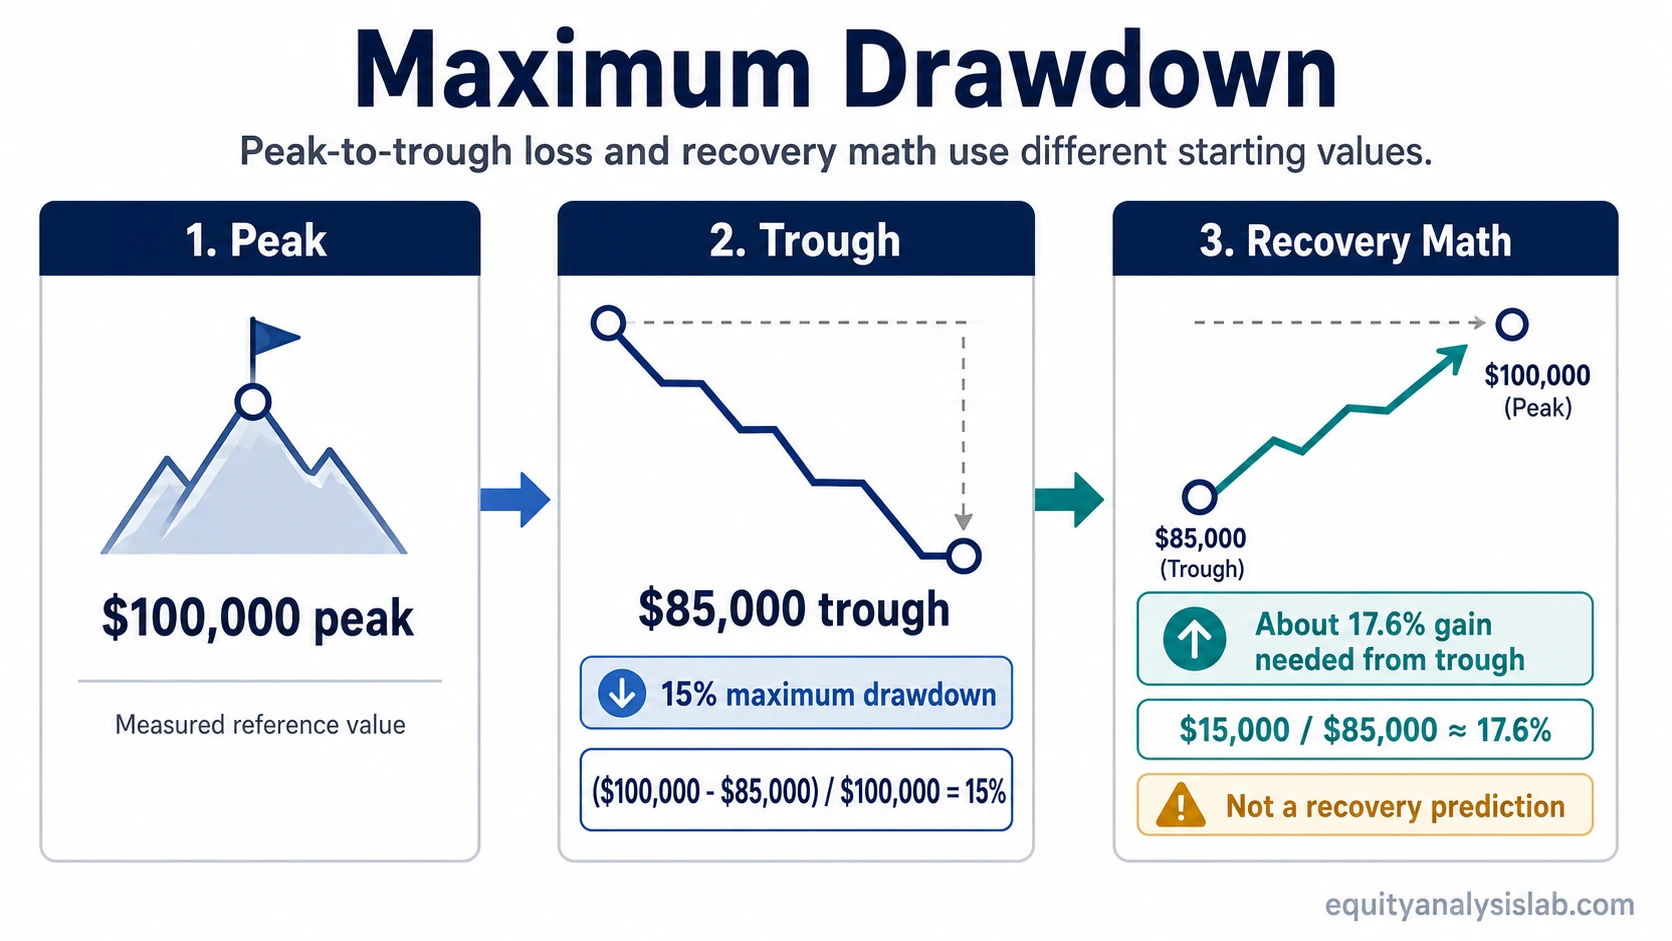
A portfolio reaches a peak value of $100,000. Later in the same measurement period, it falls to $85,000 before recovering.
Using the positive loss format:
($100,000 – $85,000) / $100,000 = 15%
The maximum drawdown for that peak-to-trough move is 15%. If the portfolio later returns from $85,000 to $100,000, the gain required from the trough is about 17.6%, calculated as $15,000 / $85,000.
The recovery percentage is larger than the drawdown percentage because the gain is measured from the smaller trough value, not from the original peak. This does not mean recovery is guaranteed; it only shows the math needed to return to the prior peak.
What Maximum Drawdown Shows in a Portfolio
Maximum drawdown shows the depth of the worst observed decline. That makes it useful for understanding the downside experience an investor would have had to sit through during the selected period.
A portfolio with a lower return but a much smaller maximum drawdown may have created a steadier experience. A portfolio with a higher return but a deeper maximum drawdown may have required more patience, liquidity, and emotional capacity from the investor.
The metric is also useful when comparing portfolios over the same period. If two portfolios are measured across different windows, the comparison can be misleading because one may have avoided a stress period that the other included.
What Maximum Drawdown Does Not Show
Maximum drawdown is important, but it is not a complete portfolio-quality test. It captures the deepest observed loss, not every path feature that matters to an investor.
| Question | What maximum drawdown can show | What it cannot show by itself |
|---|---|---|
| Loss size | The largest peak-to-trough decline in the selected period. | Whether that decline was caused by market risk, portfolio design, security selection, or timing. |
| Recovery | The depth of the decline that had to be recovered. | How long recovery took or whether recovery occurred after the measured trough. |
| Frequency | The single worst observed decline. | How often smaller losses occurred or how persistent they were. |
| Portfolio quality | How severe the downside experience looked over the measured window. | Whether the portfolio was diversified, durable, tax-efficient, or aligned with the investor’s objectives. |
| Future risk | How the portfolio behaved in the past period being measured. | How large the next drawdown may be. |
| Investor suitability | Whether the observed loss would have been uncomfortable or difficult to tolerate. | Whether the portfolio is suitable for every investor, time horizon, or cash-flow need. |
Maximum Drawdown Limitations
Maximum drawdown is historical, not predictive. A small maximum drawdown in the past does not guarantee a small drawdown in the future.
The metric is also period-dependent. If the selected period misses a larger market stress event, maximum drawdown can understate the risk an investor might face across a full cycle.
It does not show recovery duration, the frequency of smaller losses, the cause of the decline, or whether the portfolio still fits the investor’s risk capacity. Those questions require a broader review of portfolio structure and investor constraints.
Why Portfolio Construction Changes the Interpretation
The same maximum drawdown number can mean different things depending on how the portfolio is built. A 20% drawdown from a broad, balanced portfolio may signal a different risk profile than a 20% drawdown from a narrow portfolio dominated by a few related holdings.
Weights matter because a large position can drive the portfolio even when the holding count looks diversified. Overlap matters because different funds or stocks may depend on the same sector, factor, customer base, commodity, interest-rate sensitivity, or market narrative.
Concentration can make maximum drawdown more sensitive to a small number of positions.
Asset allocation can change how losses are distributed across stocks, bonds, cash, sectors, regions, and other exposures.
Rebalancing behavior also matters. A portfolio that is regularly rebalanced may experience a different drawdown path than a portfolio that lets winning positions become a larger share of total exposure. Time horizon and risk capacity determine whether the observed drawdown was manageable or too disruptive for the investor’s plan.
Maximum Drawdown vs Related Portfolio Concepts
Maximum drawdown should stay focused on the largest observed peak-to-trough loss. Nearby portfolio concepts answer different questions.
| Concept | Main question it answers | How it relates to maximum drawdown |
|---|---|---|
| Drawdown | How far has the portfolio declined from a prior peak? | Maximum drawdown is the largest drawdown inside the selected period. |
| Concentration | How dependent is the portfolio on a small number of positions or exposures? | Concentrated exposure can make a drawdown deeper or more dependent on one driver. |
| Asset allocation | How is portfolio capital distributed across major asset classes and exposure groups? | Allocation choices influence which parts of the portfolio absorb losses during stress. |
| Stock count | Does owning more holdings actually reduce exposure dependency? | The question of how many stocks should you own matters only when count is connected to weights, overlap, and review capacity. |
FAQ
Is maximum drawdown the same as drawdown?
No. Drawdown can refer to any decline from a prior peak. Maximum drawdown is the largest peak-to-trough decline observed within the selected measurement period.
Is a lower maximum drawdown always better?
Not automatically. A lower maximum drawdown can indicate a smoother past path, but it must be interpreted alongside return, time period, portfolio construction, liquidity needs, and investor risk capacity.
Can maximum drawdown predict the next portfolio decline?
No. Maximum drawdown is a historical measurement. It can help frame past downside experience, but it does not predict the size, timing, or cause of a future decline.