Implied volatility and historical volatility answer different questions: implied volatility reflects the volatility assumption embedded in current option prices, while historical volatility measures how much the underlying moved in the past over a selected lookback period.
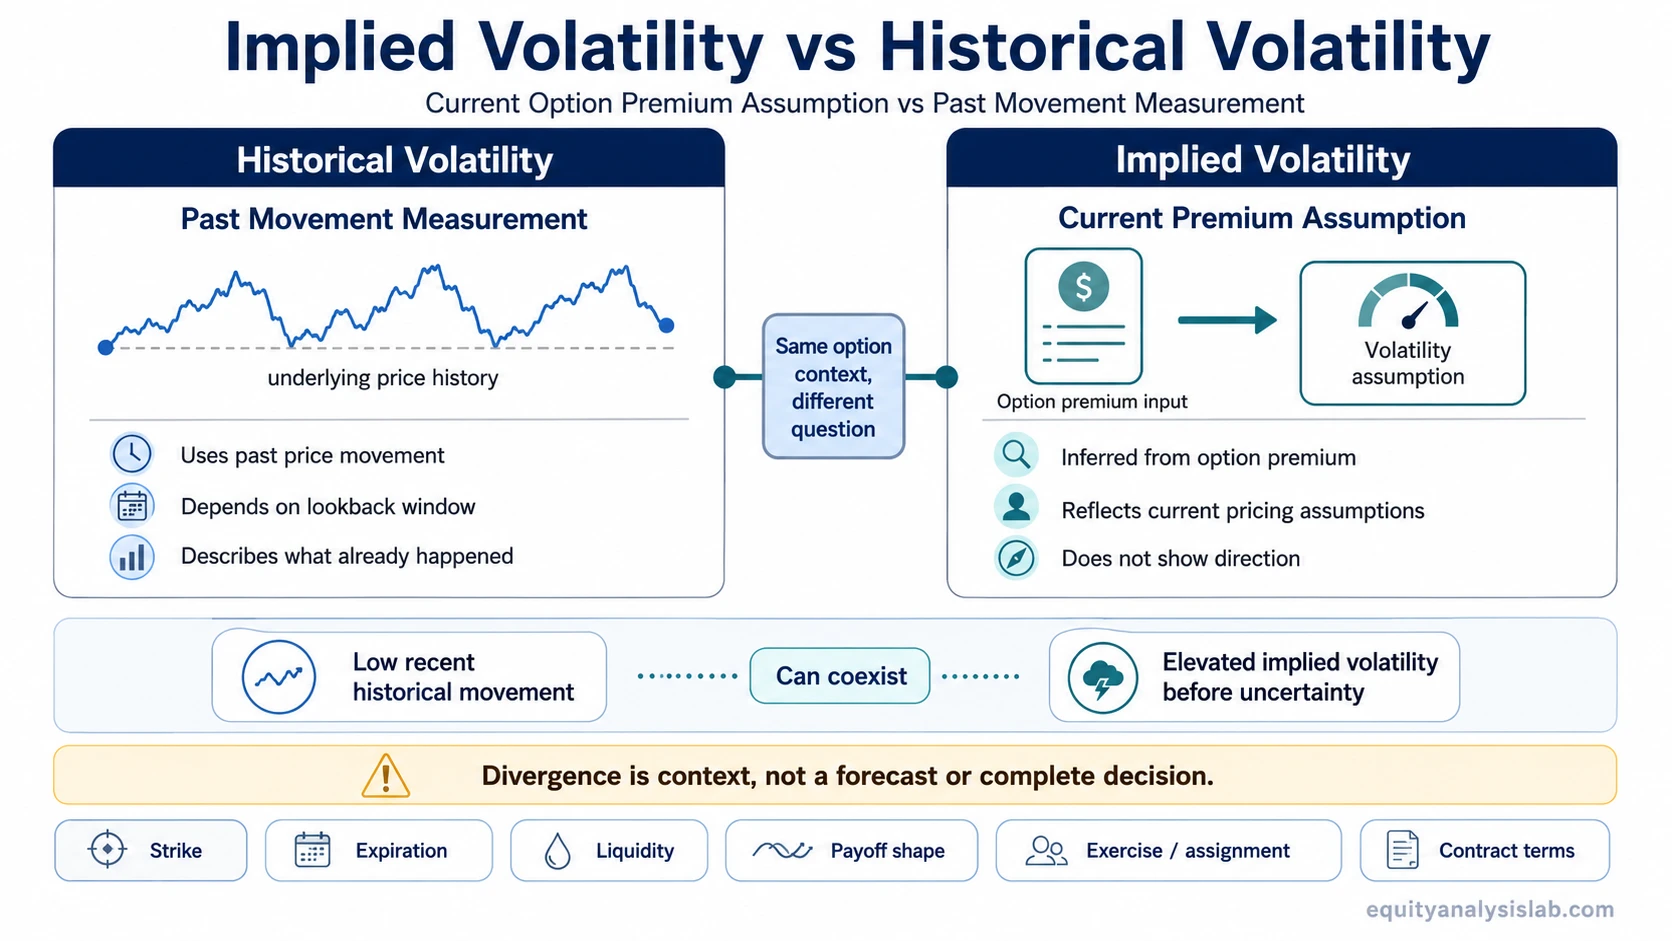
The difference matters because the two measures can point to different parts of the same options situation. Historical volatility looks backward at realized price movement. Implied volatility looks at the volatility level that is being implied by current option premiums. One describes the past movement record; the other describes the premium assumption inside the option market.
Key Points
- Implied volatility is inferred from option prices, not directly observed from future price movement.
- Historical volatility is calculated from past underlying price movement over a defined lookback window.
- A gap between IV and HV is not automatically bullish, bearish, profitable, or tradable.
- Expiration, strike, liquidity, payoff shape, and contract terms still affect how any volatility reading should be interpreted.
What Is the Difference Between Implied and Historical Volatility?
The main difference is the source of the volatility estimate. Implied volatility comes from the option premium itself. Historical volatility comes from the underlying asset’s past price movement.
Implied volatility is forward-looking only in a specific sense: it reflects the volatility assumption currently priced into options. It does not show the future path of the stock, ETF, or index. It also does not say whether the underlying will move up or down.
Historical volatility is backward-looking because it uses past price changes. A 20-day, 30-day, or 60-day historical volatility reading can change depending on the lookback period, data frequency, and calculation method. It describes what already happened during the chosen window, not what must happen next.
Simple distinction: implied volatility is a current option-pricing assumption; historical volatility is a past movement measurement.
Implied Volatility vs Historical Volatility Table
| Criteria | Implied volatility | Historical volatility |
|---|---|---|
| Time direction | Current option market assumption about expected volatility over the option’s remaining life. | Past realized movement over a selected historical lookback window. |
| Data source | Option premiums, strike, expiration, underlying price, rates, dividends if relevant, and pricing-model inputs. | Historical price changes in the underlying asset. |
| Option dependency | Requires an options market and contract-specific pricing. | Can be calculated from the underlying’s price history without using option prices. |
| What it helps explain | Why option premiums may be higher or lower relative to other contract assumptions. | How volatile the underlying has been during the chosen period. |
| What it cannot prove | Future direction, guaranteed movement, trade quality, or probability of profit. | Future direction, future volatility, or whether current option premiums are fair. |
| Common misuse | Treating high IV as an automatic reason to sell options or low IV as an automatic reason to buy options. | Treating a quiet past period as proof that future movement will also stay quiet. |
When Each Volatility Measure Is Useful
Implied volatility is useful when the question is about current option pricing. If option premiums are high, IV can help explain whether the market is embedding a larger volatility assumption into those contracts. That does not mean the option is attractive or unattractive by itself.
Historical volatility is useful when the question is about past behavior in the underlying. It can show whether the underlying has recently moved in a narrow or wide range, but the lookback window must be understood. A short window can miss older turbulence, while a long window can smooth over recent changes.
For options interpretation, the cleaner use is to compare the question each measure answers. IV asks, “What volatility assumption is embedded in this option price now?” HV asks, “How much did the underlying actually move over this past period?”
Why Implied and Historical Volatility Can Diverge
IV and HV can diverge because they are built from different inputs. Historical volatility uses what already happened in the underlying. Implied volatility is backed out of current option prices, so it can change when option premiums rise or fall relative to the contract’s other inputs.
Same Scenario, Different Reading
A company’s stock may have low historical volatility during a quiet month, while its options show elevated implied volatility before an uncertain event. That is not a contradiction. Historical volatility describes the quiet past window. Implied volatility reflects the current premium assumption embedded in the option contracts.
The comparison becomes misleading if the gap is treated as a complete decision. The gap may reflect event uncertainty, demand for option exposure, contract liquidity, expiration timing, or strike-specific pricing. It still does not prove direction or guarantee the size of the next move.
A higher IV reading can appear before earnings, product announcements, regulatory decisions, macro events, or other uncertain dates. The reason is not that the option market knows the direction. The reason is that the option premium may embed a larger uncertainty assumption around the contract’s remaining life.
A lower IV reading can appear even when the underlying moved sharply in the past if current option demand, expected event risk, and contract conditions are lower than they were during the historical window. Historical volatility may remain elevated from a prior period, while current option premiums no longer price the same level of uncertainty.
Important boundary: IV/HV divergence is a comparison signal, not a complete options decision. It does not prove that options should be bought, sold, avoided, hedged, or structured in a particular way.
Common Mistakes When Comparing IV and HV
- Mistaking IV for direction: implied volatility can rise without saying whether the underlying is expected to move up or down.
- Mistaking HV for a forecast: historical volatility describes the selected past period; it does not guarantee similar future movement.
- Assuming HV must catch up to IV: the two measures do not have to converge in a clean or useful way.
- Turning the spread into a trade signal: an IV/HV gap does not automatically create a buying, selling, or premium-selling decision.
- Ignoring contract details: the same volatility reading can mean different things across strikes, expirations, and payoff structures.
Another mistake is treating realized volatility, historical volatility, and implied volatility as interchangeable terms. Historical volatility is usually a measurement of past realized movement over a selected window. Realized volatility can also refer to the volatility that actually occurs over a future period after the option is observed. That distinction matters, but it should not distract from the main comparison: IV is option-price-implied, while HV is past-price-based.
Options Mechanics That Change the Interpretation
Volatility is only one part of an options contract. Expiration affects how much time remains for movement. Strike selection changes how the option responds to underlying price changes. Liquidity affects spreads and execution quality. Payoff shape determines how gains and losses behave across different price paths.
Assignment and exercise conditions can also matter, especially for contracts that may be affected by dividends, early exercise considerations, or settlement rules. A volatility comparison that ignores those contract mechanics can look precise while still being incomplete.
The shape of implied volatility across strikes can also matter. A volatility smile can show that implied volatility is not always uniform across strike prices. That is a related concept, but it should not replace the basic IV vs HV distinction.
IV rank and IV percentile boundary: IV rank and IV percentile compare current implied volatility with its own history. They can add context, but they are separate from the basic question of how implied volatility differs from historical volatility.
How to Read IV vs HV Without Turning It Into a Signal
A clean reading starts with the question. Use historical volatility to understand the prior movement record. Use implied volatility to understand the volatility assumption embedded in current options prices. Then treat the difference as context rather than an instruction.
For example, elevated IV against quiet HV can mean the market is pricing a potential change in uncertainty. It can also mean option demand is high, liquidity is uneven, or a specific expiration carries event risk. Quiet IV against high HV can mean the market is no longer pricing the same turbulence that occurred in the lookback period. Neither reading is complete without contract terms and payoff analysis.
Neither measure is inherently better. The comparison is most useful when it separates current option-premium context from past movement instead of turning the gap into a directional or trade-quality claim.
FAQ
Is implied volatility the same as historical volatility?
No. Implied volatility is inferred from current option prices, while historical volatility is calculated from past price movement in the underlying asset.
Does high implied volatility mean the underlying will move up?
No. High implied volatility does not predict direction. It reflects a higher volatility assumption embedded in option prices, not a bullish or bearish forecast.
Can historical volatility predict future volatility?
Historical volatility can provide context about past movement, but it does not guarantee future volatility. Market conditions, events, liquidity, and option demand can change.
Does a gap between IV and HV create an options trade?
No. An IV/HV gap is context, not a complete trade decision. Strike, expiration, liquidity, payoff shape, exercise or assignment conditions, and risk boundaries still matter.