A volatility smile is an options-pricing pattern where implied volatility differs across strike prices for options with the same or comparable expiration. The curve often reflects lower implied volatility near at-the-money strikes and higher implied volatility toward in-the-money or out-of-the-money strikes, although the exact shape can vary by market and maturity.
The important boundary is that a volatility smile describes an implied-volatility shape. It does not forecast market direction, prove probability of profit, identify which option is attractive, or replace payoff, liquidity, expiration, assignment, and exercise risk review.
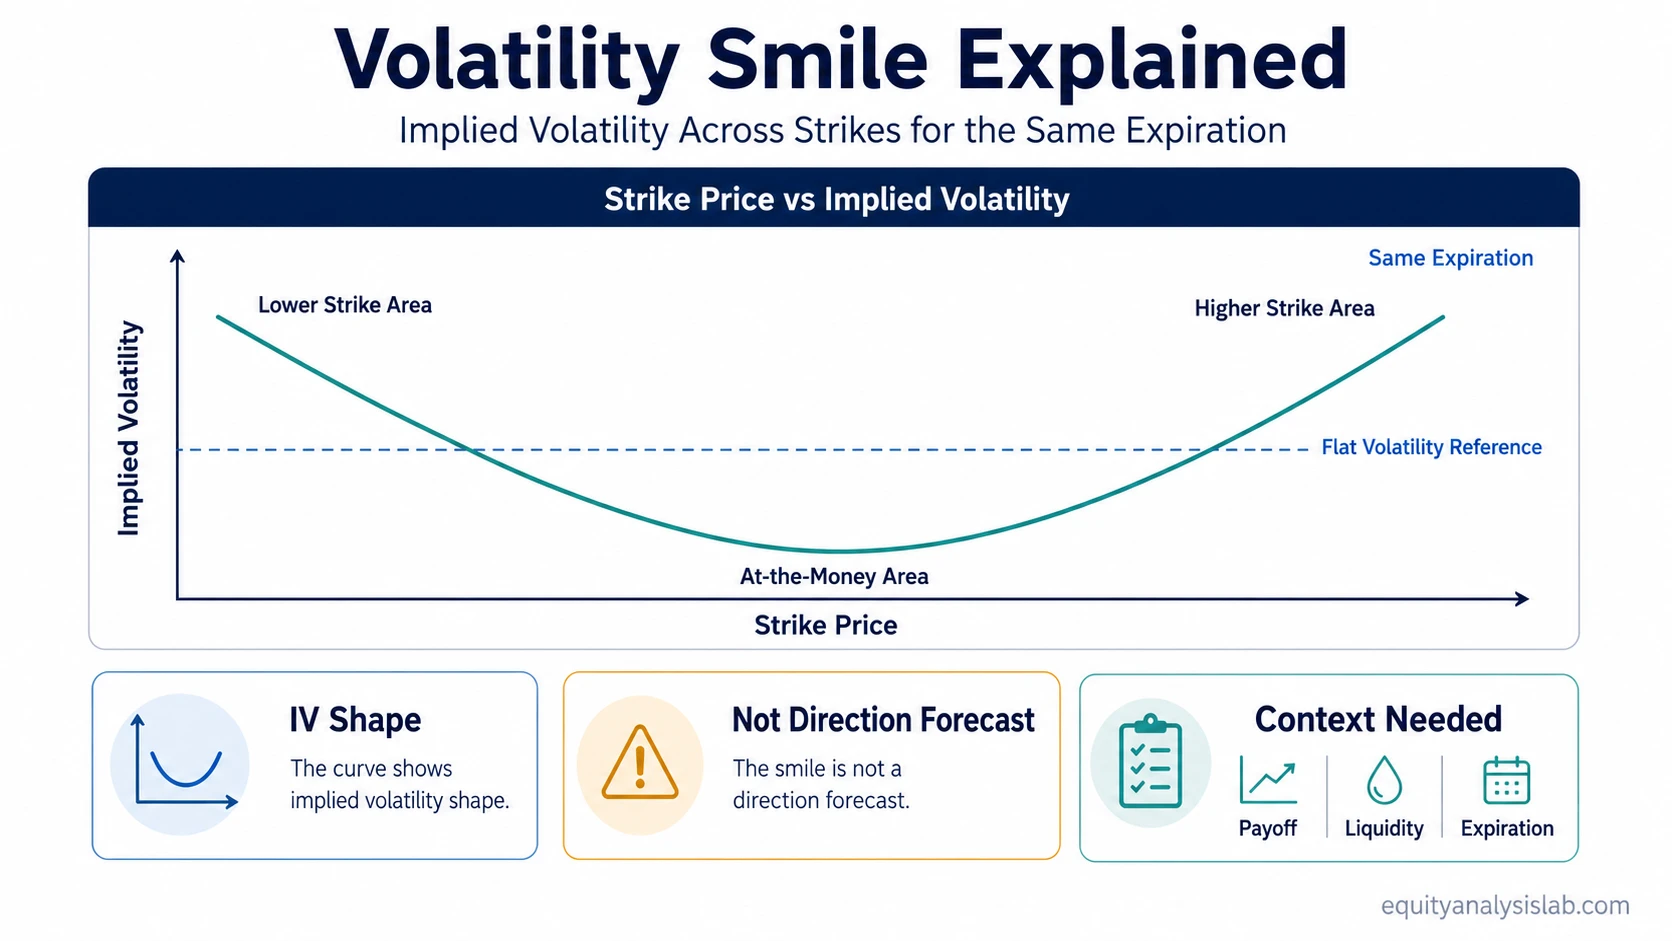
Definition: A volatility smile is the curved pattern formed when option implied volatility is plotted across strike prices for the same expiration or a closely comparable maturity.
Key Points
- A volatility smile compares implied volatility across strikes, not across unrelated expirations.
- The shape usually appears on a strike-price axis, with implied volatility on the vertical axis.
- The smile contrasts with flat-volatility assumptions used in simplified pricing models.
- The curve can help interpret how options are priced, but it does not make an options decision complete.
- Smile, skew, and volatility surface describe related but different views of option-implied volatility.
What Is a Volatility Smile?
A volatility smile shows that options with different strike prices can carry different implied volatility even when they share the same expiration. A flat line would mean the market assigns similar implied volatility across strikes. A smile-shaped curve means the implied-volatility estimate changes as strikes move away from the at-the-money area.
The curve is built from option-implied volatility, which is inferred from option prices rather than directly observed as a future volatility number. That makes the smile a pricing signal, not a realized outcome.
In options language, the strike area matters because the same underlying price can make one option at the money, another in the money, and another out of the money. The volatility smile helps show whether the market is assigning similar or different implied volatility to those areas.
How a Volatility Smile Appears Across Strikes
The cleanest way to read a volatility smile is to hold expiration constant and compare implied volatility across strike prices. Mixing expirations can turn the analysis into a term-structure or volatility-surface question instead of a single smile reading.
| Strike area | Typical relationship on a smile curve | Interpretation boundary |
|---|---|---|
| At the money | Often near the lower part of the curve | Shows the implied volatility assigned near the current underlying price, not a neutral market forecast. |
| Out of the money | May carry higher implied volatility than at-the-money options | Can reflect different demand, risk perception, or tail pricing, but does not prove that the tail event will occur. |
| In the money | May also sit above the at-the-money area depending on market and option type | Should be read with moneyness, liquidity, and expiration context rather than as a standalone signal. |
| Different expiration | Not part of the same clean smile comparison | Moves the question toward volatility term structure or surface analysis. |
The observable question is simple: for one expiration, do implied-volatility estimates stay roughly flat across strikes, or do they curve upward away from the at-the-money area?
Why a Volatility Smile Differs From Flat-Volatility Models
A simplified Black-Scholes model setup treats volatility as a constant input for the option being priced. Under that simplified assumption, comparable options would not require a different volatility input at every strike.
The volatility smile matters because real option prices often imply different volatility levels across strikes. That difference is one reason market-implied prices can diverge from what a flat-volatility assumption would suggest.
Model boundary: A smile does not mean the model is useless or that the market is irrational. It means the flat-volatility assumption is too simple to describe how market prices distribute implied volatility across strikes.
Volatility Smile vs Skew vs Surface
Smile, skew, and volatility surface are related terms, but they do not describe the same view. Keeping them separate prevents a narrow strike-based reading from turning into a broader volatility model discussion.
| Concept | What it describes | Boundary |
|---|---|---|
| Volatility smile | Implied volatility across strike prices for the same or comparable expiration | Best for a single-expiration strike comparison. |
| Volatility skew or smirk | An uneven implied-volatility slope where one side of the strike range is priced higher | Best for explaining directional asymmetry in the implied-volatility curve. |
| Volatility surface | Implied volatility across both strikes and expirations | Broader than a smile because maturity is part of the structure. |
A smile can be one cross-section of a broader volatility surface. The surface adds expiration as another dimension, while the smile keeps the focus on how implied volatility changes across strikes at a given maturity.
Volatility Smile Example in Context
A same-expiration options chain may show lower implied volatility near the strike closest to the underlying price, while both lower and higher strikes carry higher implied volatility. That creates a smile-shaped curve when the strike prices are plotted from low to high.
The observable interpretation is narrower: the options chain is assigning different implied-volatility inputs to different strike areas. The smile alone does not identify whether the pricing difference comes from hedging demand, liquidity, tail-risk pricing, contract structure, or market-specific conventions.
Illustrative scenario: A same-expiration options chain shows the lowest implied volatility near the strike closest to the underlying price, while farther lower and higher strikes carry higher implied volatility. That shape can be plotted as a smile. The observation still needs context from liquidity, bid-ask spreads, contract type, and maturity before it becomes useful for interpretation.
Related sensitivities still matter. For example, option delta helps describe underlying-price sensitivity, while the volatility smile describes how implied volatility varies across strikes.
What a Volatility Smile Can and Cannot Tell You
A volatility smile can improve pricing interpretation because it shows that the market is not assigning the same implied-volatility input to every strike. That is useful when comparing option premiums, moneyness, and model assumptions.
| Can help with | Cannot decide by itself |
|---|---|
| Seeing how implied volatility changes across strikes | Whether the underlying asset will rise or fall |
| Comparing market pricing against a flat-volatility assumption | Whether an option is cheap or expensive in a complete decision sense |
| Separating strike-based IV shape from expiration-based term structure | Probability of profit, payoff quality, or expected return |
| Recognizing where option pricing differs by moneyness | Liquidity, assignment risk, exercise risk, or position suitability |
Nonlinear exposure can still change quickly when the underlying price moves and options shift across moneyness zones. That is why gamma-related risk belongs in the risk boundary rather than inside the smile definition itself.
Common Mistakes When Reading a Volatility Smile
Common mistake: Treating the volatility smile as a directional forecast. The smile shows an implied-volatility pattern across strikes, not a prediction that the underlying asset must move toward one side of the curve.
Another mistake is comparing different expirations and calling the result a smile. Once expiration changes, the analysis starts to include term structure, not only strike-level implied volatility.
A third mistake is using the smile as a shortcut for option attractiveness. Premium, payoff shape, liquidity, bid-ask spread, assignment and exercise risk, expiration, and portfolio or position objective remain separate checks.
Limitation: A volatility smile is a market-implied pricing observation connected to model assumptions. It can clarify how implied volatility is distributed across strikes, but it cannot replace a full options risk review.
Related Options Pricing Concepts
Volatility smile analysis depends on the meaning of implied volatility, but it is not the same concept. Implied volatility describes the volatility input inferred from an option price; the smile describes how that inferred input varies across strikes.
The Black-Scholes model provides the useful contrast because its simplified flat-volatility assumption makes the smile easier to understand as a market-pricing deviation.
Delta and gamma help separate price sensitivity from volatility-shape interpretation. A smile can describe the implied-volatility curve, while delta and gamma describe different parts of option exposure.
FAQ
What does a volatility smile mean in options?
A volatility smile means implied volatility differs across strike prices for options with the same or comparable expiration. It usually appears as a curved relationship between strike price and implied volatility.
Why is implied volatility not flat across all strikes?
Implied volatility may differ across strikes because option prices reflect different risk perceptions, hedging demand, liquidity conditions, and moneyness effects. The exact reason can vary by market and expiration.
Is a volatility smile the same as volatility skew?
No. A volatility smile usually refers to a curved pattern across strikes, while skew describes an uneven slope where one side of the strike range carries higher implied volatility.
Can a volatility smile predict where the underlying asset will move?
No. A volatility smile is an implied-volatility shape across strikes. It does not forecast direction, prove probability of profit, or complete an options decision.