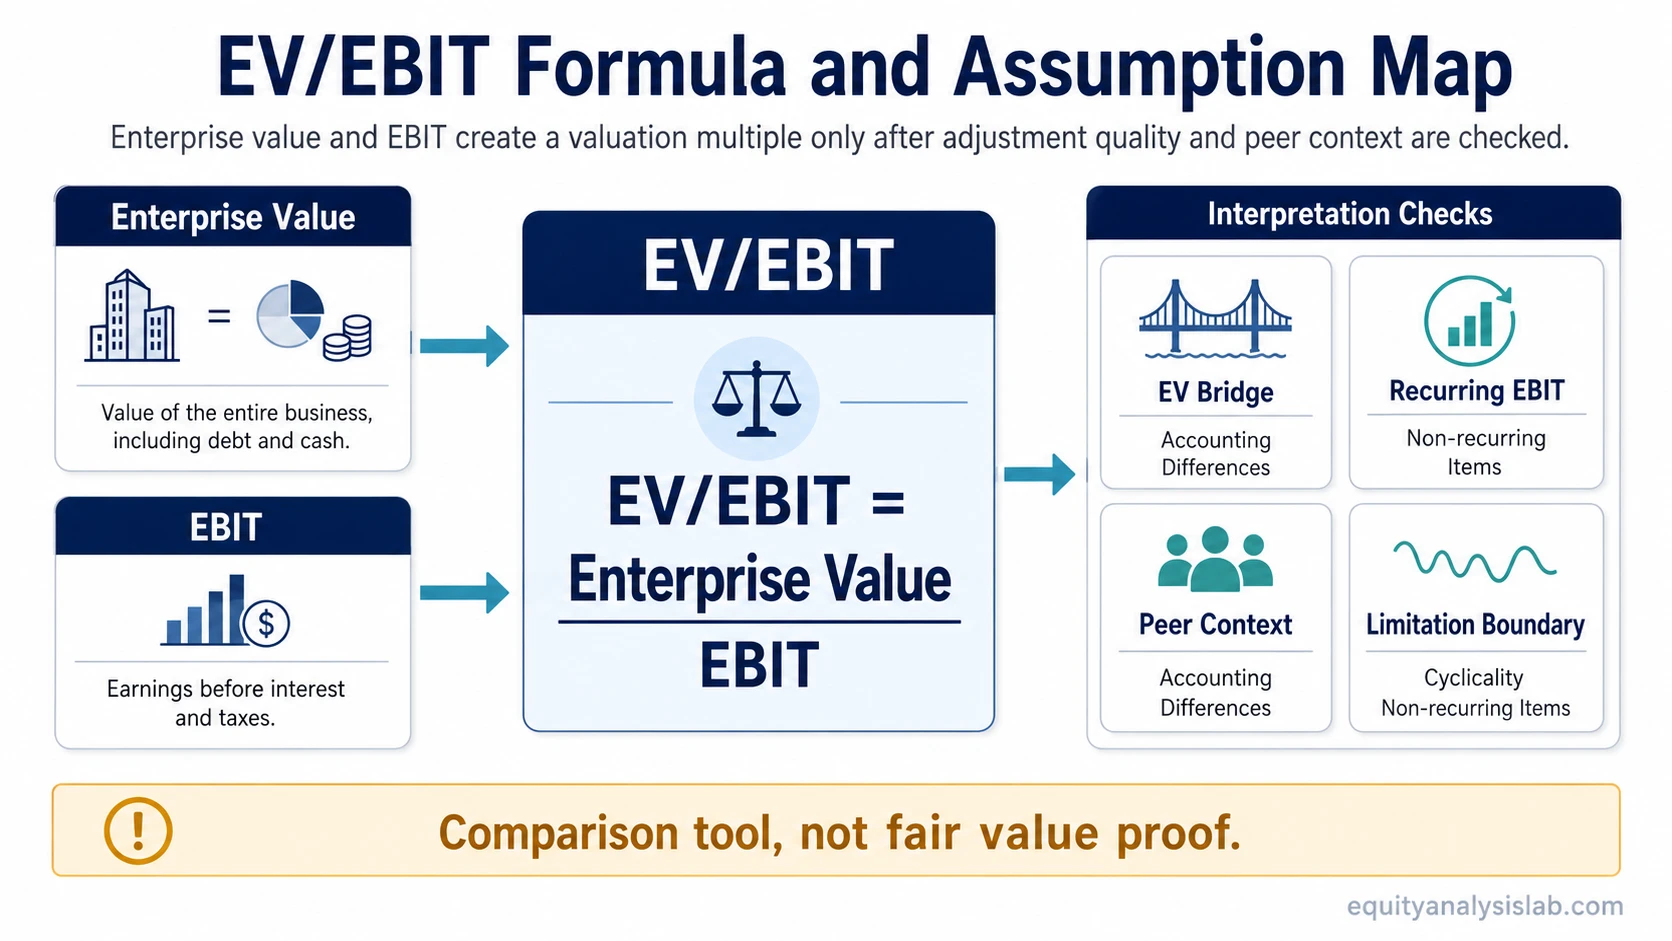
EV/EBIT is a valuation multiple that compares enterprise value with earnings before interest and taxes. The formula is EV/EBIT = Enterprise Value / EBIT. It shows how much the market is assigning to a company’s operating profit before financing and tax effects, but the number only becomes useful when EBIT quality, enterprise value adjustments, peer comparability, and cycle context are understood.
Definition: EV/EBIT is enterprise value divided by EBIT. It is a relative valuation multiple used to compare how the market values operating profit across companies with broadly similar business models, accounting policies, and capital intensity.
Key Points
- EV/EBIT compares whole-firm value with operating profit before interest and taxes.
- Enterprise value includes equity value, debt, and cash adjustments, so it is broader than market capitalization alone.
- EBIT focuses on operating profit before financing structure and tax differences.
- A lower EV/EBIT is not automatically better if EBIT is cyclical, temporarily inflated, or distorted by non-recurring items.
- The multiple is most useful when compared against similar companies and interpreted with business quality, capital intensity, and accounting differences in mind.
What EV/EBIT Means
EV/EBIT measures the price placed on a company’s operating earnings before interest and taxes. The numerator, enterprise value, represents the value of the operating business to all capital providers. The denominator, EBIT, represents operating profit before the effects of debt financing and tax structure.
The pairing matters because enterprise value is a whole-firm value measure, while EBIT is a pre-interest profit measure. A market-cap-based ratio such as price-to-earnings uses equity value and net income. EV/EBIT uses enterprise value and operating profit, so it can be cleaner when companies have different leverage levels.
That does not make EV/EBIT neutral. It still depends on what is inside enterprise value, whether EBIT is recurring, how depreciation and amortization affect the business, and whether the peer group is genuinely comparable.
EV/EBIT Formula
The basic formula is:
EV/EBIT = Enterprise Value / EBIT
Enterprise value is usually calculated as equity market value plus debt, leases, preferred stock, minority interests, pensions, and other financing claims where relevant, minus cash and cash equivalents. EBIT is operating profit before interest expense and income taxes.
| Formula input | What it represents | Why it matters |
|---|---|---|
| Enterprise value | Whole-firm value after debt and cash adjustments | Connects valuation to the operating business, not only the equity market cap. |
| EBIT | Operating profit before interest and taxes | Allows comparison before financing structure and tax effects. |
| EV/EBIT multiple | Enterprise value per unit of EBIT | Shows how much investors are paying for operating earnings before interest and taxes. |
Simple EV/EBIT Example
For example, assume a company has an enterprise value of $5 billion and EBIT of $500 million. Its EV/EBIT multiple is 10x because $5 billion divided by $500 million equals 10.
The 10x result does not prove that the company is cheap or expensive. A 10x multiple could look reasonable for a stable business with durable EBIT and modest reinvestment needs. The same 10x result is more useful when EBIT is recurring and less reliable when EBIT is temporarily lifted by peak margins or one-time gains.
The useful question is not only “what is the multiple?” The better question is what kind of EBIT the multiple is valuing.
How to Interpret EV/EBIT
A lower EV/EBIT multiple usually means the company has a lower enterprise value relative to EBIT. A higher EV/EBIT multiple means the market is assigning more value to each unit of EBIT. Those statements are mechanical, not conclusions about fair value.
A low EV/EBIT multiple may reflect undervaluation, but it may also reflect falling margins, weak business quality, high cyclicality, accounting risk, or a market expectation that current EBIT will not last. A high EV/EBIT multiple may reflect optimism, but it may also be supported by stronger returns on capital, higher EBIT durability, lower reinvestment needs, or better growth visibility.
EV/EBIT is strongest when it is used across companies with similar business models, margin structures, capital intensity, and accounting policies. The further the peer group drifts from those conditions, the more the multiple can hide rather than clarify valuation differences.
What Is a Good EV/EBIT?
There is no universal good EV/EBIT multiple. The same number can mean different things in different industries, interest-rate environments, margin cycles, and capital-intensity profiles.
A useful EV/EBIT judgment usually compares the company against a relevant peer group and then tests whether the difference is justified. The main inputs are EBIT durability, margin normalization, balance-sheet adjustments, accounting consistency, reinvestment needs, and whether the current profit level is above or below a normal cycle level.
Interpretation note: EV/EBIT is better treated as a comparison tool than as a standalone verdict. A multiple that looks low against peers may still be expensive if EBIT is overstated. A multiple that looks high may still be defensible if operating profit is durable and capital requirements are low.
EV/EBIT Assumption Sensitivity
EV/EBIT can look precise because it produces a single number. The interpretation is less precise because both enterprise value and EBIT depend on assumptions, adjustments, and business context.
| Input | Why it matters | How it can distort interpretation |
|---|---|---|
| Enterprise value bridge | Debt, cash, leases, preferred stock, minority interests, pensions, and other claims can change the numerator. | An incomplete EV bridge can make two companies look more comparable than they are. |
| Recurring EBIT quality | The denominator should reflect sustainable operating profit. | If recurring EBIT is weaker than reported EBIT, the multiple can look lower than the business actually deserves. |
| Non-recurring items | Restructuring charges, gains on disposals, impairments, unusual cost cuts, or disruptions can affect EBIT. | One-time items can make the multiple look artificially low or high unless EBIT is adjusted consistently. |
| Depreciation and capital intensity | EBIT includes depreciation and amortization effects, but it does not directly show future reinvestment needs. | A company with heavy maintenance capital expenditure may deserve a different multiple than an asset-light business with similar EBIT. |
| Peer group | The multiple is usually interpreted relative to comparable companies. | A weak peer set can turn a clean formula into a misleading valuation comparison. |
| Cyclicality | EBIT can rise sharply near the top of a cycle and fall sharply near the bottom. | A cyclical company can look optically cheap on peak EBIT and optically expensive on trough EBIT. |
| Accounting differences | Depreciation schedules, amortization, capitalization policies, and restructuring treatment can affect EBIT. | Different accounting treatments can change reported EBIT even when economic performance is similar. |
| Leverage and cash balance | Debt, cash, and financing structure affect enterprise value even when EBIT is similar. | Two companies with the same EBIT can carry different EV/EBIT multiples because the balance-sheet bridge changes the numerator. |
EV/EBIT vs EBIT/EV
EV/EBIT and EBIT/EV use the same inputs in reverse order. EV/EBIT shows enterprise value as a multiple of EBIT. EBIT/EV shows EBIT as a percentage of enterprise value.
For example, a 10x EV/EBIT multiple is equivalent to a 10% EBIT/EV yield. The inverse format can be useful when investors want to think in yield terms, but it does not remove the need to judge EBIT quality, balance-sheet adjustments, and peer comparability.
EV/EBIT vs EV/EBITDA
EV/EBIT and EV/EBITDA both compare enterprise value with operating performance before financing effects. The difference is that EV/EBIT uses EBIT, while EV/EBITDA adds back depreciation and amortization.
That difference matters most when depreciation, amortization, and capital intensity are important to the business. EV/EBIT can be more sensitive to asset intensity because depreciation remains in the denominator. EV/EBITDA can make companies with different asset bases look more similar than they are if the depreciation add-back hides real reinvestment needs.
Neither ratio is automatically better. EV/EBIT can be more conservative for businesses where depreciation reflects real economic wear. EV/EBITDA can be useful when depreciation and amortization create noise, but it needs careful handling when capital spending is material.
When EV/EBIT Can Mislead
Limitation: EV/EBIT becomes less reliable when EBIT is negative, temporarily depressed, temporarily inflated, heavily cyclical, or materially affected by non-recurring items. It can also mislead when enterprise value adjustments are incomplete or when the peer group has different leverage, capital intensity, or accounting treatment.
Negative EBIT makes the multiple difficult to interpret because the denominator no longer represents positive operating earnings. Very low EBIT can also create extreme multiples that look mathematically dramatic but add little analytical clarity.
Cyclical businesses need special care. During strong periods, EBIT may be above normal and the EV/EBIT multiple may look low. During weak periods, EBIT may be below normal and the multiple may look high. The ratio is most useful when the analyst tests current EBIT against normalized earnings power instead of reading the multiple in isolation.
Non-recurring items also matter. Restructuring charges, asset impairments, gains on disposals, temporary cost reductions, and unusual operating disruptions can all affect EBIT. A clean EV/EBIT comparison usually requires an adjusted view of recurring operating profit, with the adjustment logic stated clearly.
How EV/EBIT Fits With Other Valuation Multiples
EV/EBIT is one valuation multiple, not a complete valuation model. It is most useful when it answers a specific question: how the market is valuing operating profit before financing and tax effects.
For companies where current operating profit is weak or not yet meaningful, EV/Revenue may appear in the analysis, although revenue multiples need their own margin and profitability context. For companies where growth differences explain much of the valuation gap, the PEG ratio addresses a different question by connecting earnings multiples with expected growth.
The best use of EV/EBIT is usually comparative and conditional. It can narrow the valuation discussion, but it should not replace analysis of business quality, balance sheet structure, cash flow conversion, or normalized earnings power.
FAQ
Is a lower EV/EBIT always better?
No. A lower EV/EBIT can indicate a lower valuation relative to EBIT, but it can also reflect weak business quality, falling margins, cyclical peak earnings, non-recurring profit, or higher risk. The multiple needs context before it can support a valuation judgment.
Is EV/EBIT the same as EBIT/EV?
No. EV/EBIT is enterprise value divided by EBIT, while EBIT/EV is EBIT divided by enterprise value. They use the same inputs in reverse order. EV/EBIT is a multiple, while EBIT/EV is often read as an operating earnings yield.
When is EV/EBIT misleading?
EV/EBIT can be misleading when EBIT is negative, unusually high, unusually low, cyclical, or distorted by non-recurring items. It can also mislead when enterprise value adjustments are incomplete or the peer group is not comparable.