Trailing P/E compares the current share price with reported earnings from a past period, while forward P/E compares the current share price with expected future earnings. The same stock can look different under each ratio because the earnings denominator changes: one is already reported, and the other depends on estimates that can be revised.
Core distinction: trailing P/E uses reported earnings per share, usually from the last twelve months. Forward P/E uses estimated earnings per share, usually for a future period such as the next fiscal year or next twelve months.
What Forward P/E and Trailing P/E Compare
Both ratios start with the same basic idea: share price divided by earnings per share. The difference is the earnings layer used in the denominator. A broader price-to-earnings ratio framework explains the base multiple, while the forward versus trailing comparison focuses on whether the earnings input is reported or estimated.
Trailing P/E answers a past-earnings question: how much investors are paying for earnings the company has already reported. Forward P/E answers an expectations question: how much investors are paying relative to earnings analysts or the market expect the company to produce later.
Trailing P/E: price divided by reported EPS.
Forward P/E: price divided by estimated future EPS.
Interpretation rule: neither ratio proves that a stock is cheap, expensive, fairly valued, or mispriced. Each ratio frames the same share price against a different earnings assumption.
Forward P/E vs Trailing P/E Comparison Table
| Comparison point | Trailing P/E | Forward P/E |
|---|---|---|
| Earnings source | Reported EPS | Estimated future EPS |
| Time period | Past period, often last twelve months | Future period, often next fiscal year or next twelve months |
| Main strength | Uses earnings that have already been reported | Connects valuation to expected future earnings power |
| Main weakness | Can be distorted by earnings that are no longer representative | Can be distorted by estimates that later change |
| Revision risk | Lower, because the denominator is already reported | Higher, because the denominator depends on forecasts |
| Distortion risk | One-time gains, one-time charges, cyclic peaks, cyclic troughs | Optimistic estimates, pessimistic estimates, margin assumptions, demand assumptions |
| Best use | Checking what investors are paying for realized earnings | Checking what investors are paying for expected earnings |
| Main limitation | Past EPS may not represent normalized earning power | Forecast EPS is not guaranteed and can be revised |
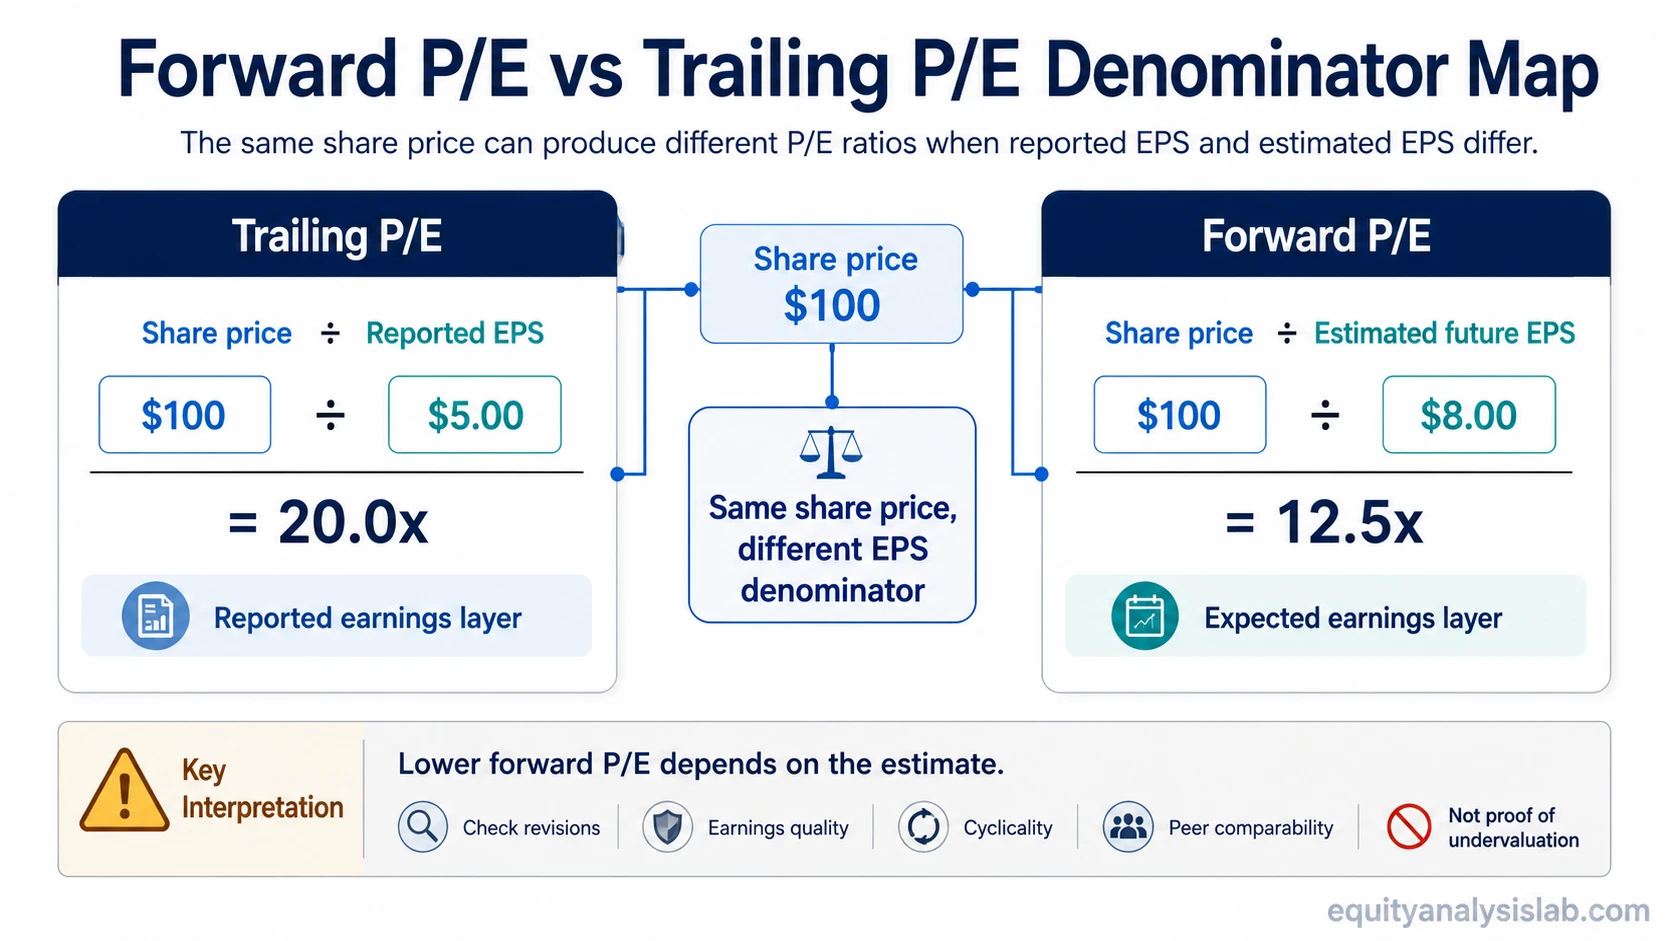
Example: Same Share Price, Different Earnings Denominator
Illustrative example: assume a company trades at $100 per share. Its reported last-twelve-month EPS is $5.00, while next-year estimated EPS is $8.00.
| Input | Value | Result |
|---|---|---|
| Trailing P/E | $100 share price / $5.00 reported EPS | 20.0x |
| Forward P/E | $100 share price / $8.00 estimated EPS | 12.5x |
The stock did not become cheaper between the two calculations. The denominator changed. The forward multiple looks lower because the example assumes higher future EPS. If that estimate is revised down, the forward P/E would rise even if the share price does not move.
Why Forward and Trailing P/E Can Disagree
Forward P/E and trailing P/E disagree when reported earnings and expected earnings tell different stories. That gap can be useful, but only if the reason for the gap is understood.
| Reason for disagreement | How it affects the comparison | What to check |
|---|---|---|
| Growth expectations | Forward P/E may look lower if EPS is expected to rise | Whether expected growth is realistic and durable |
| Estimate revisions | Forward P/E can change quickly if analyst estimates move | Direction and size of EPS revisions |
| One-time earnings | Trailing P/E can be distorted by temporary gains or charges | Recurring earnings versus unusual items |
| Cyclicality | Trailing EPS may be unusually high near a cycle peak or unusually low near a trough | Normalized margins and cycle position |
| Margin normalization | Future EPS may assume margins improve or decline | Cost structure, pricing power, and operating leverage |
| Peer differences | Two companies can show similar P/E ratios for very different reasons | Business model, accounting, growth, margins, and earnings quality |
When Trailing P/E Can Mislead
Trailing P/E can mislead when the last reported earnings period is not representative. A company may have benefited from a temporary margin spike, a one-time gain, unusually strong demand, or a cycle peak. In those cases, trailing EPS can make the multiple look lower than the company’s normalized earnings power would justify.
The opposite can also happen. A temporary charge, restructuring cost, downturn, or cyclic trough can make trailing EPS unusually low. That can make trailing P/E look high even if future earnings may recover. The ratio is still useful, but it needs earnings-quality context.
When Forward P/E Can Mislead
Forward P/E can mislead when the estimated EPS denominator is too optimistic or too pessimistic. A low forward P/E may reflect high future earnings estimates rather than a genuinely attractive valuation. If those estimates are revised lower, the forward multiple can rise without any change in share price.
Forecast EPS also depends on assumptions about revenue growth, margins, taxes, interest expense, share count, and business conditions. A forward P/E comparison is stronger when those assumptions are visible, realistic, and comparable across the peer group.
How to Use Both Ratios Together
Trailing P/E tests price against realized earnings. Forward P/E tests price against expected earnings. Used together, the gap between them shows what must be believed about future earnings for the current valuation to make sense.
If forward P/E is much lower than trailing P/E: the market or analyst estimates may be expecting earnings growth. The next question is whether that growth is supported by revenue quality, margin durability, cash flow, and business conditions.
If forward P/E is close to trailing P/E: the market may be assuming relatively stable earnings. The next question is whether stability is realistic or whether the business is facing a change in demand, costs, or margins.
If forward P/E is higher than trailing P/E: the market may be expecting earnings to decline. The next question is whether the decline is temporary, structural, cyclical, or already reflected in the share price.
Across peers, the comparison only works when the estimate period, accounting treatment, business model, growth profile, margin structure, capital intensity, and earnings quality are reasonably comparable. A forward P/E based on next fiscal year EPS is not the same as one based on next-twelve-month EPS if the companies have different fiscal calendars or different stages of an earnings cycle.
Which Ratio Is Better?
Neither forward P/E nor trailing P/E is automatically better. Trailing P/E has the advantage of using reported earnings, but those earnings may be stale or distorted. Forward P/E has the advantage of looking toward expected earnings, but those expectations can be wrong.
The stronger approach is to ask what each ratio is testing. Trailing P/E tests the price against what the company has already earned. Forward P/E tests the price against what the company is expected to earn. The disagreement between them is often the starting point for analysis, not the conclusion.
Related Valuation Concepts
Forward and trailing P/E are part of a valuation-multiple toolkit, but nearby comparisons answer different questions. Growth-adjusted comparisons belong closer to the P/E vs PEG ratio distinction. Enterprise-value comparisons belong closer to EV/EBITDA vs P/E, where capital structure, cash, debt, and EBITDA matter more directly.
FAQ
Is forward P/E usually lower than trailing P/E?
Forward P/E is often lower when earnings are expected to grow, but it can be higher when earnings are expected to decline. The direction depends on the future EPS estimate, not on the ratio being inherently better or worse.
Can a low forward P/E mean a stock is undervalued?
A low forward P/E can suggest that the share price is low relative to expected earnings, but it does not prove undervaluation. The estimate may be too high, the business may face risk, or the market may be pricing in weaker earnings quality.
Why can trailing P/E look high while forward P/E looks low?
That usually happens when expected future EPS is higher than reported past EPS. The key question is whether the expected earnings improvement is realistic, durable, and comparable to peers.