Dividend coverage ratio measures how many times a company’s earnings, or in some versions cash flow, covers dividends paid over a defined period.
It is related to dividend payout ratio and dividend yield, but it answers a different question: whether the company’s profit or cash generation is large enough relative to the dividend obligation.
Definition: Dividend coverage ratio, also called dividend cover, is a coverage metric that compares a company’s earnings or cash flow with the dividends it paid during the same period.
Key Points
- Dividend coverage ratio compares dividend payments with earnings or cash flow over the same period.
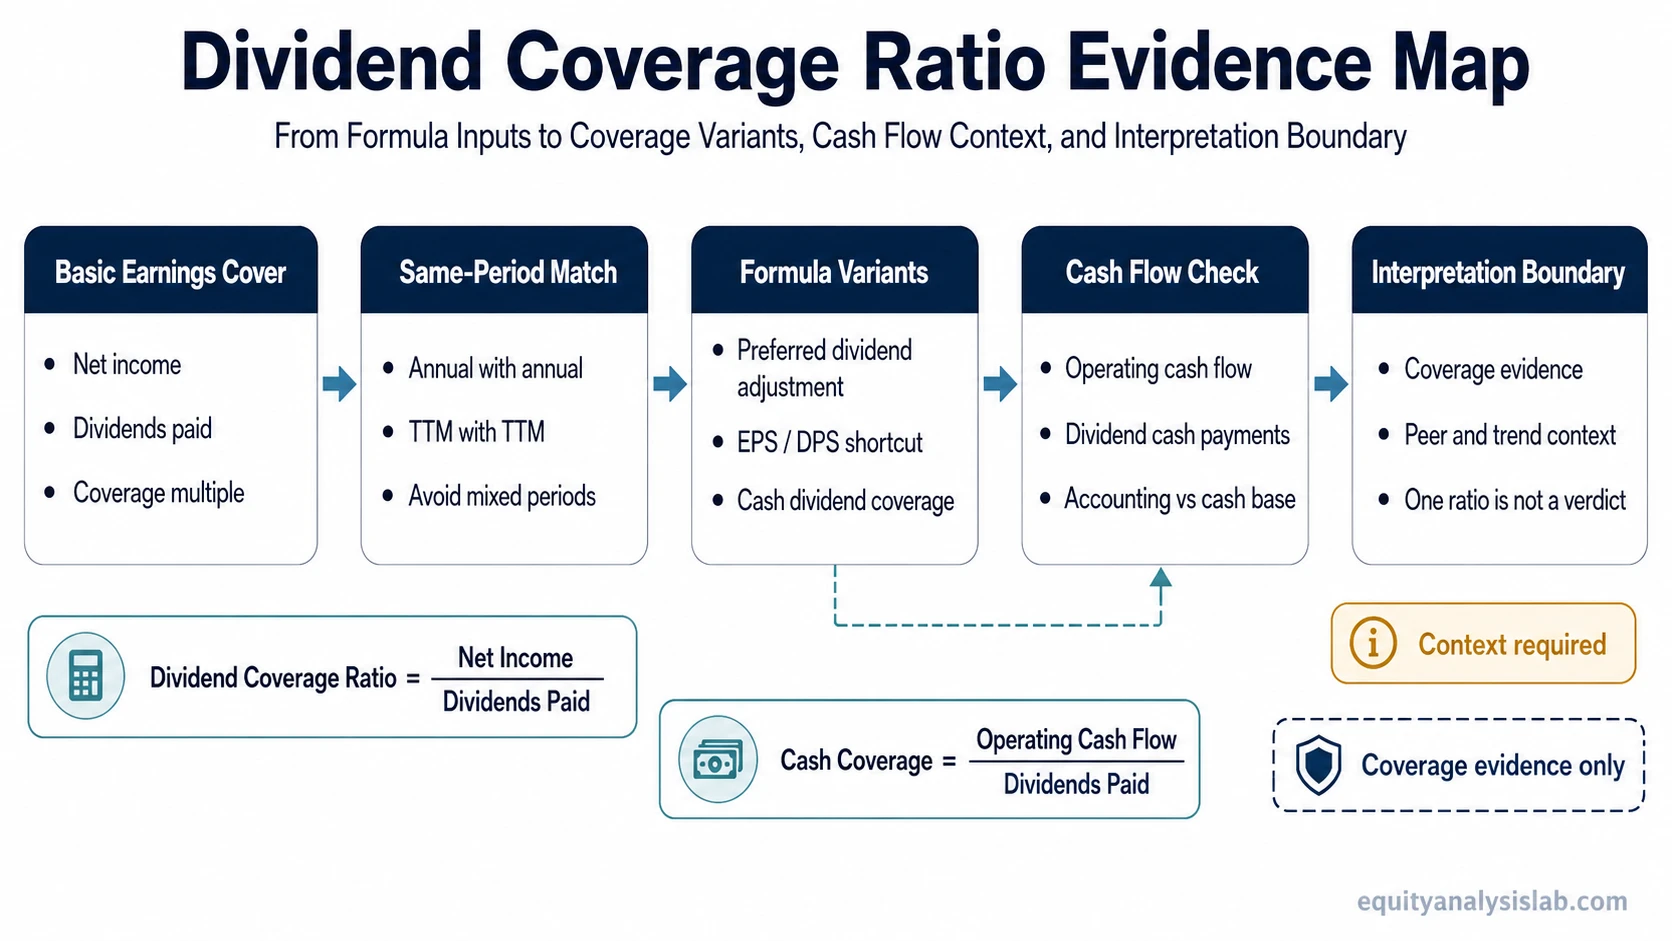
- The basic formula uses net income divided by dividends paid.
- Adjusted versions may use preferred dividend deductions, EPS divided by DPS, or operating cash flow divided by dividends paid.
- A higher ratio can suggest more coverage, but it does not prove that a dividend is secure.
- Dividend cover is more useful when compared with cash flow, payout ratio, dividend yield, peer norms, and the company’s own trend.
Dividend Coverage Ratio Meaning
Dividend coverage ratio shows the cushion between what a company earns and what it distributes as dividends. If a company earns substantially more than it pays out, the ratio will be higher. If dividends consume most of earnings, the ratio will be lower.
The ratio is often used in dividend sustainability analysis because it links capital returns to the income statement or cash flow statement. It should still be read as one diagnostic input, not as a complete dividend conclusion.
Dividend cover is especially useful when the analysis separates dividend capacity from dividend attractiveness. A large cash dividend may look appealing through market price, but coverage asks whether the company’s own earnings or cash generation can support that payment.
Dividend Coverage Ratio Formula
The basic dividend coverage ratio formula is:
Dividend Coverage Ratio = Net Income / Dividends Paid
Both numerator and denominator should refer to the same period. Annual net income should be compared with annual dividends paid, while trailing twelve-month earnings should be compared with trailing twelve-month dividends.
Dividend coverage ratio and payout ratio often describe the same dividend burden from opposite directions: payout ratio asks what share of earnings is distributed, while coverage asks how many times earnings cover the distribution.
| Formula version | Calculation | Best use |
|---|---|---|
| Basic earnings coverage | Net income / Dividends paid | Quick view of how many times earnings cover total dividends. |
| Common-shareholder coverage | (Net income – Preferred dividends) / Common dividends | Useful when preferred shareholders have a prior claim on earnings. |
| Per-share coverage | EPS / DPS | Useful when earnings per share and dividends per share are measured on a consistent basis. |
| Cash dividend coverage ratio | Operating cash flow / Common dividends paid | Useful when cash generation may differ meaningfully from reported net income. |
The formula variant matters because earnings coverage and cash coverage can give different readings. Net income reflects accounting profit, while operating cash flow reflects cash generated from operations before financing and investing decisions.
How to Calculate Dividend Coverage Ratio
A simple illustrative example can show the mechanics. A company reports $120 million in net income and pays $40 million in common dividends during the same fiscal year.
Illustrative calculation: $120 million net income / $40 million dividends paid = 3.0x dividend coverage.
A 3.0x result means earnings were three times the dividend amount for that period. It only means reported earnings were larger than the dividend payment by that multiple.
If the same company also owes $10 million in preferred dividends, common-shareholder coverage should be adjusted before comparing earnings with common dividends:
Adjusted common-shareholder calculation: ($120 million net income – $10 million preferred dividends) / $40 million common dividends = 2.75x common dividend coverage.
The adjustment matters because preferred dividends reduce the earnings available to common shareholders before the common dividend is analyzed.
What the Inputs Actually Mean
The dividend coverage ratio is only as useful as the inputs behind it. The most common mistake is treating the final multiple as more precise than the underlying accounting base allows.
| Input or boundary | What it means | Interpretation risk |
|---|---|---|
| Net income | Accounting profit available after expenses, taxes, and other income-statement items. | Can be affected by one-time gains, accruals, impairments, or non-cash items. |
| Dividends paid | Cash distributions paid to shareholders during the selected period. | Must match the same time period as the numerator. |
| Preferred dividends | Payments owed to preferred shareholders before common-shareholder coverage is assessed. | Ignoring preferred dividends can overstate common dividend coverage. |
| EPS / DPS | Per-share shortcut comparing earnings per share with dividends per share. | Can mislead if share count, special dividends, or per-share basis is inconsistent. |
| Operating cash flow | Cash generated by core operations before financing decisions. | May reveal weaker or stronger dividend coverage than earnings alone. |
| Time period | Annual, fiscal-period, or trailing twelve-month basis. | A mismatched numerator and denominator can distort the ratio. |
| Peer set | Comparison group with similar business model, capital needs, and dividend policy. | Different sectors can support different normal coverage ranges. |
| Trend | How coverage changes across multiple periods. | A single year can be distorted by cyclicality, one-off earnings, or temporary dividend policy. |
How to Interpret Dividend Coverage Ratio
A higher dividend coverage ratio usually indicates a larger earnings cushion relative to dividends paid. A lower ratio usually indicates that dividends are consuming more of the company’s earnings base.
The interpretation is strongest when the ratio is compared across time, against similar companies, and against cash-flow evidence. A company with stable earnings, strong operating cash flow, and consistent coverage has a different profile from a cyclical company with one unusually strong earnings year.
A low ratio may reflect temporary pressure rather than a permanent dividend problem. Management can maintain a dividend through a downturn, use balance-sheet flexibility, or adjust capital spending. A high ratio can also be misleading when earnings are inflated by one-time items or cash conversion is weak.
Interpretation boundary: Dividend coverage ratio is coverage evidence. It is not a dividend safety guarantee, stock quality score, valuation conclusion, or investment recommendation.
Coverage Reading Map
Dividend cover is most useful when the multiple is tested against the accounting base behind it, the cash flow that funds distributions, and the company’s normal capital needs.
| Coverage reading | What to compare | Why it matters |
|---|---|---|
| Earnings coverage looks strong | Operating cash flow and free cash flow direction | Accounting profit can overstate cash-funded dividend capacity. |
| Coverage is improving | Dividend growth, earnings trend, and share count trend | Improvement is more meaningful when it comes from durable earnings rather than dividend cuts or one-time gains. |
| Coverage is weakening | Margin trend, revenue cyclicality, debt cost, and capital spending needs | Weakening coverage can reflect temporary pressure or a more durable strain on distributable capacity. |
| Cash coverage differs from earnings coverage | Working capital, accruals, non-cash gains, and operating cash flow | The gap can reveal whether dividends are supported by cash generation or mainly by accounting earnings. |
| Coverage differs from peers | Sector norms, business cyclicality, and capital intensity | Some business models require more retained cash than others, so peer context matters. |
Dividend Coverage Ratio vs Nearby Dividend Metrics
Dividend coverage ratio overlaps with other dividend metrics, but each one answers a different question. Keeping the boundaries clear reduces the risk of treating yield, payout, growth, and reinvestment as substitutes for coverage.
| Metric | Main question | Boundary against dividend coverage ratio |
|---|---|---|
| Dividend payout ratio | What share of earnings is distributed as dividends? | Payout ratio looks at distribution intensity, while dividend coverage ratio looks at how many times earnings cover the dividend. |
| The dividend compared with the stock price | How large is the dividend relative to market price? | Yield is price-relative. It does not measure whether earnings or cash flow cover the dividend. |
| Dividend growth rate | How quickly has the dividend changed over time? | Growth rate measures change in the dividend amount, while coverage checks whether the payment is supported by earnings or cash flow. |
| Reinvesting dividends | What happens after dividends are received? | Reinvestment describes investor use of the dividend after payment, not the company’s ability to fund the dividend. |
Limitations and Common Mistakes
Dividend coverage ratio can look precise because it produces a clean multiple, but the ratio can hide several important limitations.
Common mistake: Treating a high dividend coverage ratio as a standalone dividend-safety verdict. Coverage may look comfortable even when earnings are temporary, cash conversion is weak, leverage is rising, or the dividend policy depends on management discretion.
Net income is not the same as cash available for dividends. A company can report strong earnings while operating cash flow is pressured by working capital, receivables, inventory, or other timing effects. The cash-flow variant helps test whether the dividend is supported by actual operating cash generation.
Cyclical companies can also produce misleading coverage readings. Earnings may rise sharply near a cycle peak and make the dividend appear well covered, only for coverage to weaken when margins normalize. A multi-year trend is usually more informative than a single period.
Dividend policy remains discretionary. A company may maintain, raise, freeze, or reduce dividends for reasons that go beyond one formula, including debt management, reinvestment needs, acquisition plans, regulation, or capital allocation priorities.
When Earnings Coverage and Cash Coverage Diverge
A company with stable reported earnings may show 3.0x dividend coverage on the basic formula. That looks more comfortable than a company covering its dividend only 1.1x, but the comparison remains incomplete without the cash-flow base, capital needs, and peer context.
If the 3.0x company generated weak operating cash flow because receivables rose sharply, earnings coverage may overstate the cash cushion. If the 1.1x company is passing through a temporary earnings trough but still has conservative leverage and resilient cash flow, the low earnings coverage may need more context before it becomes a dividend-risk conclusion.
The diagnostic question is whether earnings, cash flow, balance-sheet flexibility, and dividend policy point in the same direction.
FAQ
What is a dividend coverage ratio?
Dividend coverage ratio is a metric that compares a company’s earnings or cash flow with the dividends it paid during the same period.
What is the dividend coverage ratio formula?
The basic formula is net income divided by dividends paid. Adjusted versions may subtract preferred dividends, use EPS divided by DPS, or compare operating cash flow with dividends paid.
When should preferred dividends be adjusted in dividend coverage ratio?
Preferred dividends should be deducted when the analysis focuses on common-shareholder coverage, because preferred shareholders have a prior claim before common dividends are assessed.
Why can cash-flow coverage differ from earnings coverage?
Net income includes accounting items that may not equal cash generated from operations. Operating cash flow can reveal whether the dividend is supported by cash generation as well as reported profit.