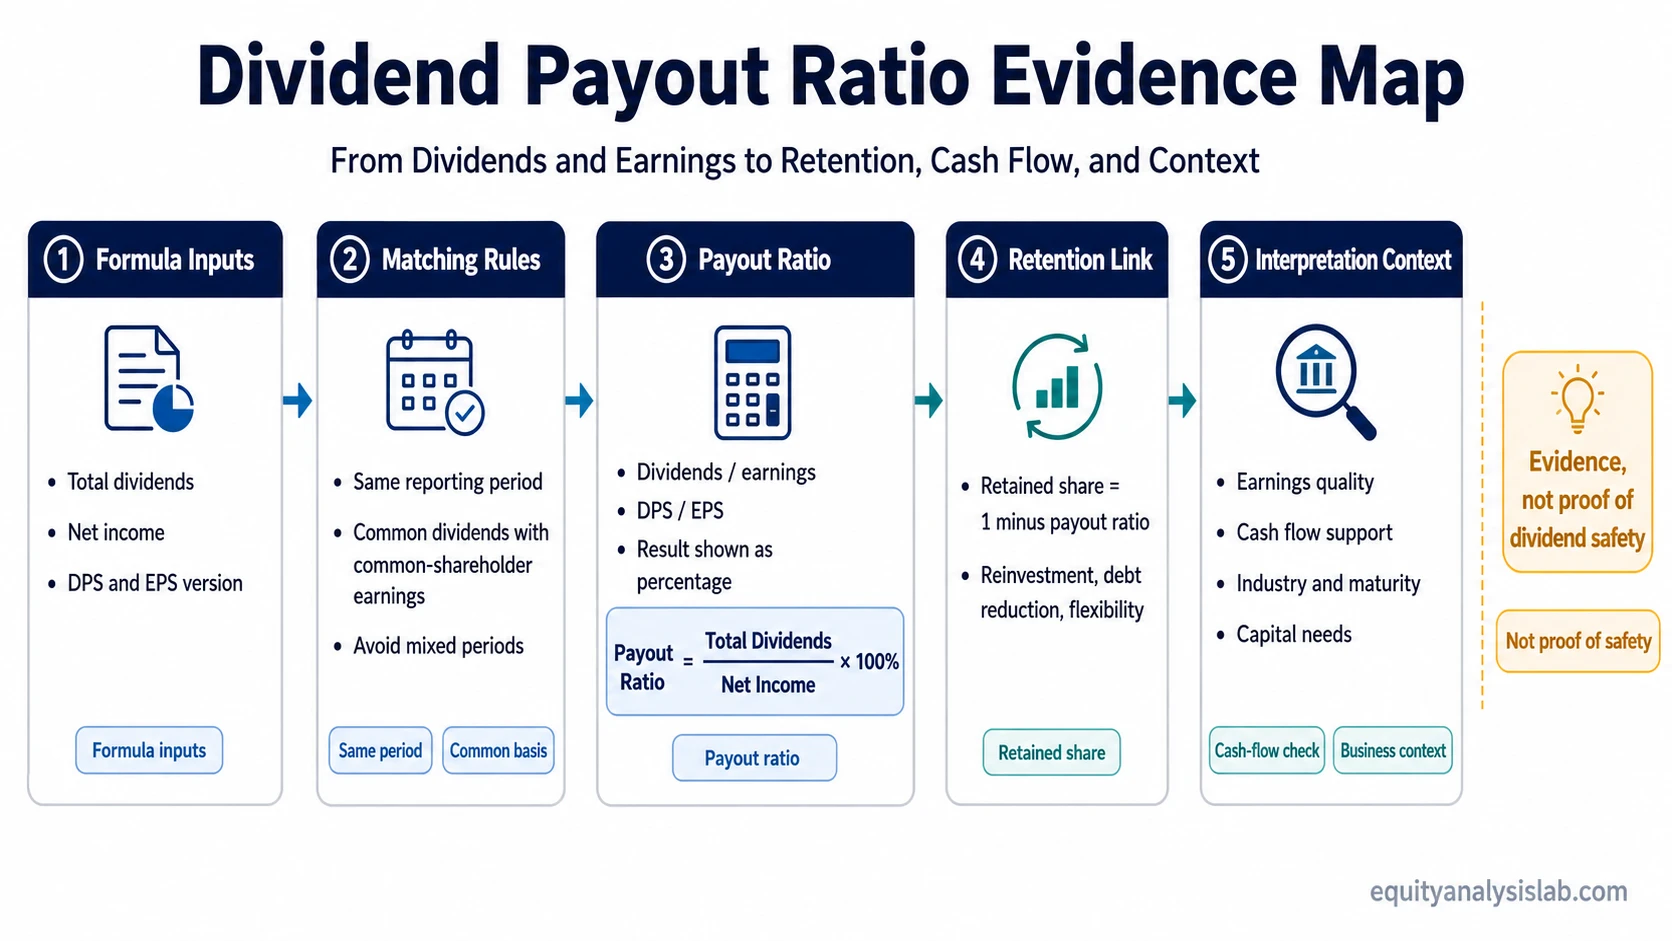
Dividend payout ratio measures the share of earnings a company distributes as dividends instead of retaining in the business. The basic formula compares dividends with net income, or dividends per share with earnings per share. It helps interpret distribution policy, but it does not prove dividend safety on its own. Because the ratio is earnings-based, it should be checked against cash flow before it is treated as dividend-support evidence.
Definition: Dividend payout ratio is a company-analysis metric that shows how much of a company’s earnings are paid to shareholders as dividends during a specific period.
A payout ratio connects the income statement with capital-return policy. It can show whether dividends consume a small, moderate, or large share of reported earnings, but its meaning depends on earnings quality, cash flow, reinvestment needs, and the company’s stage of maturity.
Key Points
- Dividend payout ratio compares dividends with earnings.
- The formula can use total dividends divided by net income, or dividends per share divided by earnings per share.
- Interpretation depends on industry, maturity, earnings durability, capital intensity, and reinvestment needs.
- Payout ratio is different from dividend yield, dividend growth, and dividend coverage.
- The ratio is evidence about distribution policy, not a guarantee that a dividend is sustainable.
What Dividend Payout Ratio Means
Dividend payout ratio shows the portion of profit distributed to shareholders instead of being retained for reinvestment, debt reduction, acquisitions, buybacks, or balance-sheet flexibility. A 40% payout ratio means the company distributed 40% of its earnings as dividends and retained the remaining 60%, assuming the calculation uses the same earnings basis.
The ratio is most useful when dividend policy needs to be compared with the company’s earnings base. A mature utility, a regulated infrastructure company, and a fast-growing software company may have very different reinvestment needs, so the same payout ratio can carry different implications across business models.
Dividend Payout Ratio Formula
The most common dividend payout ratio formula compares total dividends with net income:
Dividend payout ratio = total dividends paid / net income
A per-share version uses dividends per share and earnings per share:
Dividend payout ratio = dividends per share / earnings per share
Both formulas express the same basic idea when the inputs are matched correctly. For common-shareholder analysis, the cleanest version compares common dividends with earnings available to common shareholders over the same period. Mixing annual dividends with quarterly earnings, or common dividends with an earnings figure that is not adjusted for preferred claims when relevant, can make the result misleading.
Dividend Payout Ratio Inputs
The formula is simple, but the interpretation depends on how each input is defined. The strongest reading comes from consistent inputs, matching periods, and an earnings base that is not dominated by unusual items.
| Input or relationship | What it tells the analyst | What can distort the reading |
|---|---|---|
| Common dividends for the matched period | Shows the amount distributed to common shareholders through dividends during the period. | Special dividends, preferred dividends, declared-versus-paid timing, and mismatched periods can affect comparability. |
| Net income | Provides the reported earnings base used to compare dividend distributions with profit. | One-off gains, write-downs, non-cash items, cyclical margins, or tax effects can temporarily inflate or depress earnings. |
| Dividends per share | Shows the dividend amount attributable to each common share. | Share count changes can affect per-share comparisons across periods. |
| Earnings per share | Provides a per-share earnings base for comparing DPS with EPS. | Dilution, unusual earnings items, or temporary margin changes can change the apparent payout burden. |
| Retention relationship | Shows the portion of earnings not paid as dividends when the payout ratio is subtracted from 100%. | The retained amount may not translate into productive reinvestment if capital allocation is weak. |
How To Calculate Dividend Payout Ratio
A company that earns $100 million and pays $40 million in dividends has a dividend payout ratio of 40%:
Example: $40 million in dividends / $100 million in net income = 40% dividend payout ratio.
The same result appears in a per-share calculation. If a company reports $5 of earnings per share and pays $2 of dividends per share, the payout ratio is also 40%:
Per-share example: $2 DPS / $5 EPS = 40% dividend payout ratio.
The number means that 40% of that period’s earnings were distributed as dividends. The ratio is a starting point for testing earnings quality, cash conversion, reinvestment needs, and balance-sheet flexibility.
How To Interpret High and Low Dividend Payout Ratios
A high or low dividend payout ratio needs context before it is useful. The interpretation changes when the company’s lifecycle, business model, capital needs, earnings stability, and balance-sheet position change.
| Payout ratio pattern | Possible interpretation | Context to check before concluding |
|---|---|---|
| Low payout ratio | The company retains most earnings, which may support reinvestment, debt reduction, or future flexibility. | Check whether retained capital is being used productively. A low payout can still be weak evidence if reinvestment returns are poor. |
| Moderate payout ratio | The company balances shareholder distributions with retained earnings. | Compare the ratio with peers, earnings volatility, cash flow conversion, and reinvestment requirements. |
| High payout ratio | The company distributes a large share of earnings and has less earnings retained inside the business. | Check whether earnings are durable and whether cash flow supports the dividend through normal business conditions. |
| Payout ratio above earnings | Dividends exceed reported earnings for the period. | This may be temporary, but it requires closer review of cash flow, balance sheet support, and unusual earnings items. |
Industry comparison matters. Capital-light mature businesses may distribute a larger share of earnings than companies that need heavy reinvestment. Cyclical businesses can also show sharp payout-ratio swings when earnings temporarily fall.
Retention Ratio and Reinvestment Relationship
Dividend payout ratio also connects to the retention ratio. When both are based on the same earnings measure, the retained share is generally calculated as one minus the payout ratio.
Retention ratio = 1 – dividend payout ratio
If the payout ratio is 40%, the retained portion is 60%. That retained portion may fund reinvestment, debt reduction, acquisitions, liquidity reserves, or other uses of capital. The analytical question is not only how much is retained, but whether retained capital can produce durable returns inside the business.
Dividend policy also interacts with investor behavior. When dividends are received and then used to buy more shares, reinvested dividends become part of the investor’s compounding path rather than a direct use of capital by the company.
Dividend Payout Ratio vs Dividend Yield
Dividend payout ratio and dividend yield answer different questions. Payout ratio compares dividends with earnings. Yield compares dividends with market price.
Payout ratio: How much of earnings are distributed?
Yield: How much dividend income is received relative to the share price?
A stock can have a high yield because the dividend is large, because the share price has fallen, or both. That is why dividend income relative to price should be interpreted separately from how much of the company’s earnings are being paid out.
Payout Ratio vs Dividend Coverage Ratio
Dividend payout ratio measures distribution share. It asks how much of earnings are paid out as dividends. Dividend coverage ratio asks a related but different question: how well earnings or cash flow cover the dividend obligation.
The distinction matters because a payout ratio can look manageable while cash flow is temporarily weak, or look elevated because accounting earnings are temporarily depressed. Earnings-based payout analysis is useful, but cash dividend support still needs a separate check.
Limits and Common Mistakes
Dividend payout ratio becomes weaker evidence when net income is temporarily inflated, temporarily depressed, heavily affected by non-cash items, or not matched to the same dividend period. A clean calculation still needs a clean earnings base.
Common mistake: A higher payout ratio is not automatically better, and a lower payout ratio is not automatically worse. A high ratio can pressure flexibility if earnings weaken, while a low ratio can still be unattractive if retained capital is used poorly.
Limitation: Dividend payout ratio is earnings-based. Cash available for dividends can differ from accounting earnings because working capital, capital expenditures, debt service, and non-cash accounting items affect cash generation. Temporarily depressed earnings can also make the payout ratio spike even when the dividend amount has not changed much.
The ratio works best as part of a broader capital-return review. Earnings durability, free cash flow, balance-sheet strength, reinvestment needs, and management’s capital allocation history all change how the same payout ratio should be interpreted.
Related Capital-Return Metrics
Dividend payout ratio should stay separate from nearby capital-return metrics. Each metric answers a different analytical question, and combining them too quickly can hide the real driver of the dividend story.
| Metric | Main question | Why it is different from payout ratio |
|---|---|---|
| Dividend payout ratio | How much of earnings are paid as dividends? | Focuses on the distribution share of earnings. |
| Dividend coverage ratio | How well are dividends covered? | Focuses on support or coverage rather than distribution share. |
| Dividend yield | How large is the dividend relative to price? | Uses market price, not earnings, as the comparison base. |
| Dividend growth | How has the dividend changed over time? | Dividend growth rate measures the pace of dividend change, not the share of earnings distributed. |
Keeping these measures separate makes the capital-return analysis cleaner. A company can have a low payout ratio, a modest yield, and strong dividend growth, or a high yield with weak coverage. The combination matters more than any single ratio in isolation.
FAQ
What is dividend payout ratio?
Dividend payout ratio is the percentage of earnings a company pays out as dividends during a specific period. It compares dividends with net income, or dividends per share with earnings per share.
How do you calculate dividend payout ratio?
Divide total dividends by net income, or divide dividends per share by earnings per share. The inputs should refer to the same reporting period.
Is a high dividend payout ratio bad?
A high dividend payout ratio is not automatically bad. It can be normal for mature businesses, but it requires closer review of earnings durability, cash flow, balance-sheet strength, and reinvestment needs.
How is dividend payout ratio different from dividend yield?
Dividend payout ratio compares dividends with earnings. Dividend yield compares dividends with the share price. One measures distribution policy, while the other measures dividend income relative to market price.