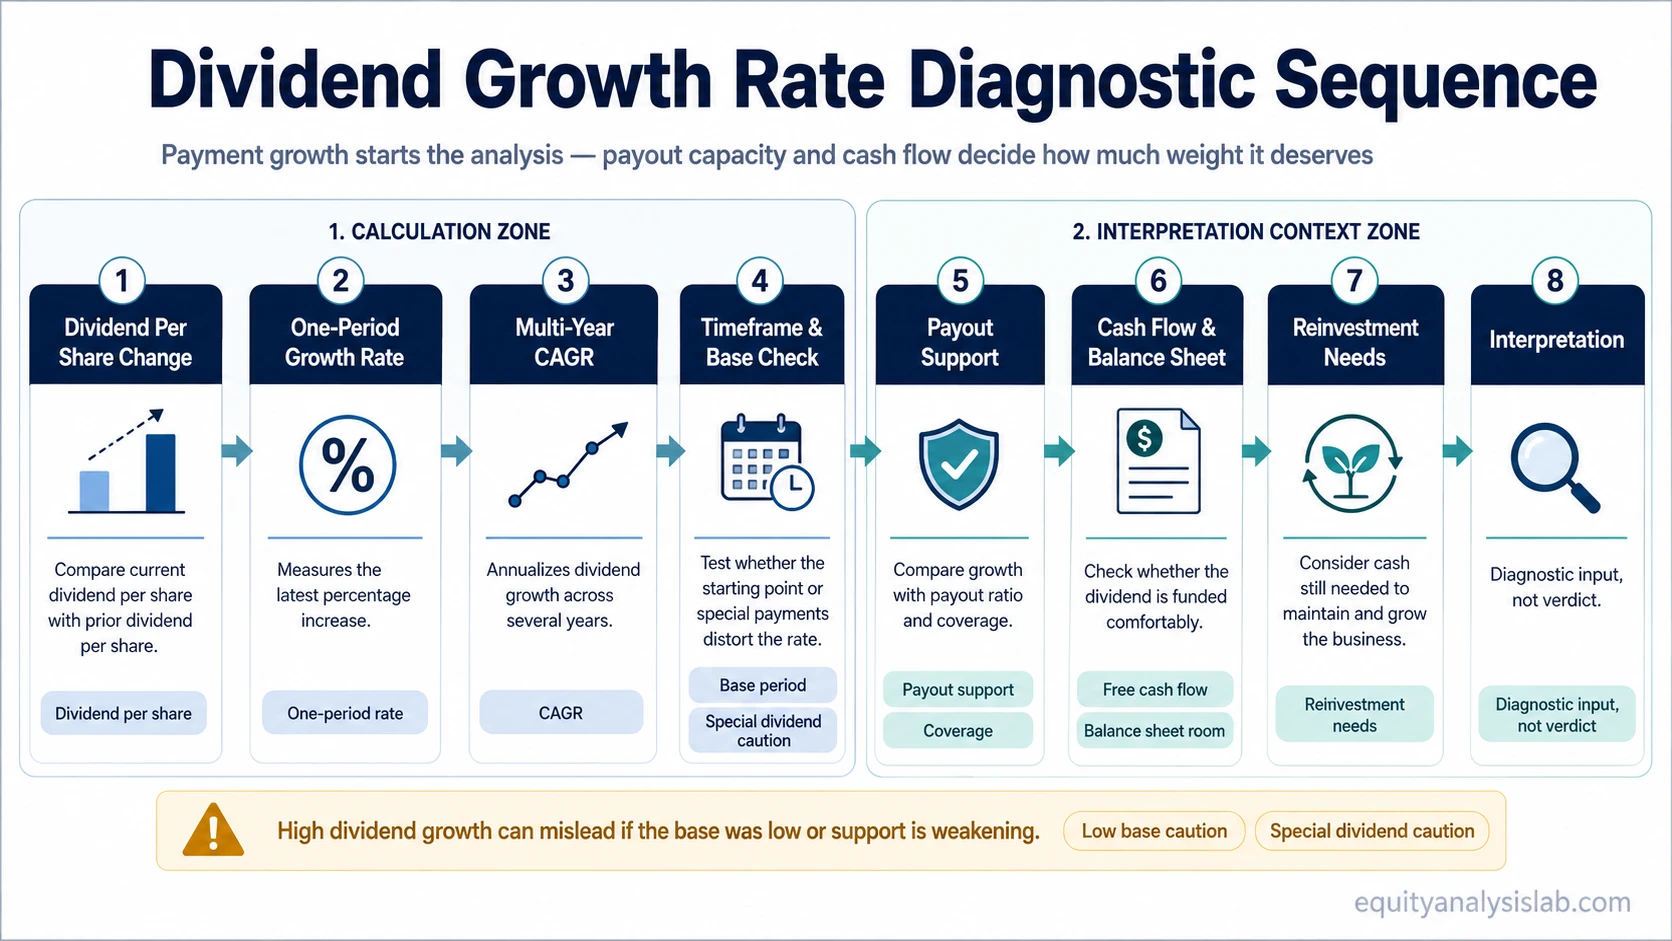
Dividend growth rate measures the percentage increase in a company’s dividend payment over a selected period. It can be calculated as a one-period growth rate or as a multi-year compound annual growth rate, but the number is only useful when it is compared with payout capacity, free cash flow, balance sheet strength, and the company’s need to reinvest in the business.
Definition: Dividend growth rate is the rate at which a company’s dividend per share grows over a chosen period. It shows how quickly the dividend payment itself has increased, not whether the stock is attractive or whether the dividend is sustainable.
For investors, dividend growth rate is a capital-return metric. It helps describe how a company’s dividend policy has changed over time, but it does not explain the full quality of that policy by itself. A dividend can grow because earnings and cash flow are improving, but it can also grow because management is stretching the payout, using balance-sheet capacity, or increasing from a very low base.
Key Points
- Dividend growth rate measures the percentage growth in dividend payments over a chosen period.
- One-year dividend growth and multi-year CAGR answer different questions.
- A high dividend growth rate is not automatically a sign of business quality.
- Sustainability depends on earnings growth, payout ratio, dividend coverage, free cash flow, balance sheet strength, and reinvestment needs.
- Dividend growth rate should be interpreted alongside dividend yield and payout support, not in isolation.
What Is Dividend Growth Rate?
Dividend growth rate shows how much a company’s dividend payment has increased over a specific period. The input is normally dividend per share, not total cash dividends, because investors usually want to know how the payment attached to each share has changed.
The period matters. A one-year dividend growth rate shows the latest increase from one dividend level to another. A multi-year growth rate smooths the pattern and can show whether dividend increases have been steady, uneven, or dependent on one unusually large change.
The metric is most useful as a starting point for dividend-policy analysis. It can show whether management has been increasing distributions, but it does not show whether those increases were funded by durable earnings, excess free cash flow, debt capacity, or a weaker reinvestment program.
Dividend Growth Rate Formula
The basic one-period dividend growth rate formula compares the current dividend with the previous dividend:
Dividend growth rate = (Current dividend per share − Previous dividend per share) ÷ Previous dividend per share × 100
For a multi-year period, investors often use compound annual growth rate, or CAGR, because it converts the total change into an annualized growth rate:
Dividend growth CAGR = [(Ending dividend per share ÷ Beginning dividend per share)1 ÷ number of years − 1] × 100
The one-period formula is useful for the latest dividend increase. The CAGR formula is more useful when the investor wants to compare dividend growth across several years or across companies with different annual increase patterns.
How to Calculate Dividend Growth Rate
Use the same dividend basis for both periods. If the current number is annual dividend per share, the prior number should also be annual dividend per share. Mixing quarterly, annual, regular, and special dividends can distort the result.
Example: A company paid $1.00 per share in dividends last year and $1.10 per share this year. The dividend growth rate is:
($1.10 − $1.00) ÷ $1.00 × 100 = 10%
The dividend increased by 10% over the period. That calculation shows the growth in the payment, but it does not show whether the increase was funded by earnings, free cash flow, or the balance sheet.
The same logic applies to a multi-year calculation, but the interpretation changes. A dividend that grows from $1.00 to $1.50 over five years has increased by 50% in total, but the annualized growth rate is lower because the change happened over several years.
Using the CAGR formula, the annualized dividend growth rate is about 8.45%: [(1.50 ÷ 1.00)1 ÷ 5 − 1] × 100.
YoY Dividend Growth vs CAGR vs Trendline Growth
Different dividend growth methods answer different questions. The best method depends on whether the investor is testing the latest increase, a multi-year record, or the consistency of the pattern.
| Method | What it measures | Best use | What can distort it |
|---|---|---|---|
| Year-over-year dividend growth | The percentage increase from one period to the next | Checking the latest dividend increase | One-time catch-up increases, special dividends, or a low prior-year base |
| Dividend growth CAGR | The annualized growth rate over several years | Comparing longer dividend growth records | Starting-point and ending-point selection |
| Trendline dividend growth | The broader direction and consistency of dividend increases | Testing whether growth is steady or uneven | Short histories, irregular payments, and changes in dividend policy |
A single-year increase can look strong even when the longer record is uneven. A multi-year CAGR can look stable even when the company had several flat years followed by one large increase. The calculation should match the question being asked.
How Investors Interpret Dividend Growth Rate
Dividend growth rate can help investors read a company’s capital-return behavior. A steady pattern of dividend increases may suggest that management is willing to return more cash to shareholders over time, but the interpretation depends on what is happening underneath the dividend.
The strongest interpretation usually comes when dividend growth is supported by rising earnings, durable free cash flow, reasonable payout levels, and a balance sheet that is not being strained to maintain the distribution. In that setting, dividend growth may reflect a healthier capital-return policy.
The weaker interpretation appears when dividends grow faster than the business can support. A company can raise the dividend to preserve a reputation, signal confidence, or satisfy income-oriented shareholders even if cash generation is becoming less comfortable. That is why dividend growth rate should be read as a diagnostic input, not a verdict.
DDM boundary note: Dividend growth rate can be an input in dividend discount model or Gordon Growth Model thinking, but it is not a complete valuation model by itself. A growth assumption used in valuation needs separate support from business quality, payout capacity, and long-term reinvestment economics.
Why Dividend Growth Rate Can Mislead
A high dividend growth rate can be misleading when the base period was unusually low. For example, a small dividend increase from a very low starting dividend may produce a high percentage growth rate without changing the company’s overall capital-return profile very much.
Special dividends can also distort the reading. If a company pays an irregular dividend in one year, a simple formula may treat that payment as part of normal dividend growth even though it does not represent a recurring dividend policy.
Common mistake: Do not treat dividend growth rate as proof that the dividend is safe. Dividend safety depends on the company’s ability to fund the payment through earnings, cash flow, and balance sheet capacity while still reinvesting enough in the business.
Another risk is payout strain. If dividends are growing faster than earnings or free cash flow, the dividend may consume a larger share of the company’s financial capacity. In that case, the growth rate can look attractive while the sustainability of the policy is weakening.
Dividend Growth Rate vs Related Dividend Metrics
Dividend growth rate is easy to confuse with other dividend metrics because they all describe capital returns. Each one answers a different question.
Dividend growth rate: How fast has the dividend payment grown?
Dividend yield: How much dividend income does the stock price currently represent?
Dividend payout ratio: How much of earnings are being distributed as dividends?
Dividend coverage ratio: How much support exists for the dividend payment?
Dividend reinvestment: What happens if received dividends are used to buy more shares instead of being taken as cash?
A company can have a high dividend growth rate and a low yield if the stock price has risen or if the starting dividend was small. It can also have strong recent dividend growth while payout support is weakening. The growth rate tells one part of the dividend story, not the whole story.
What to Check Before Giving Dividend Growth Rate Weight
Dividend growth rate becomes more useful when it is connected to the company’s ability to keep funding the dividend. The first check is whether earnings and free cash flow are growing with the dividend, not lagging far behind it.
The next check is payout support. A rising dividend payout ratio can show that more of the company’s earnings are being distributed. That is not automatically bad, but it leaves less room for business reinvestment, balance-sheet repair, or future dividend increases if earnings weaken.
Coverage also matters. A company with a strong dividend coverage ratio has more room to absorb normal variation in profits or cash flow than a company whose dividend is already close to the edge of its support.
Reinvestment needs can change the interpretation. A capital-light business with stable cash generation may support dividend increases more easily than a company that needs heavy spending to maintain its assets, fund growth, or protect its competitive position. Dividend growth should not be judged separately from the cash the business still needs to keep operating well.
Finally, compare the metric with peers and with the company’s own history. A dividend increase that looks high in isolation may be normal for a company recovering from a low base, while a smaller increase may be meaningful for a mature company with a long record of stable distributions.
How Dividend Growth Rate Fits Into Capital-Return Analysis
Dividend growth rate measures the growth of the payment. It should sit beside related capital-return metrics rather than replace them.
Use the dividend yield context to understand income relative to price. Use payout and coverage metrics to test whether the payment is supported. Use dividend history to understand consistency. Use cash flow and reinvestment needs to judge whether the company can keep increasing distributions without weakening the business.
Dividend growth also has a compounding boundary. If dividends are reinvested, the investor’s share count may grow over time, but reinvesting dividends is a separate investor-level decision from the company’s dividend growth rate. The company controls the dividend payment; the investor controls what happens to the cash after it is received.
FAQ
What is a good dividend growth rate?
There is no universal good dividend growth rate. The number depends on the company’s maturity, industry, payout level, cash-flow durability, reinvestment needs, and prior dividend base. A high rate can be less attractive if it is not supported by the business.
Is dividend growth rate the same as dividend yield?
No. Dividend growth rate measures how fast the dividend payment has grown. Dividend yield compares the dividend with the current stock price. One measures payment growth; the other measures income relative to price.
Should special dividends be included in dividend growth rate?
Special dividends should be handled carefully because they are not usually part of the recurring dividend policy. For sustainability analysis, investors often separate regular dividends from irregular special payments.