
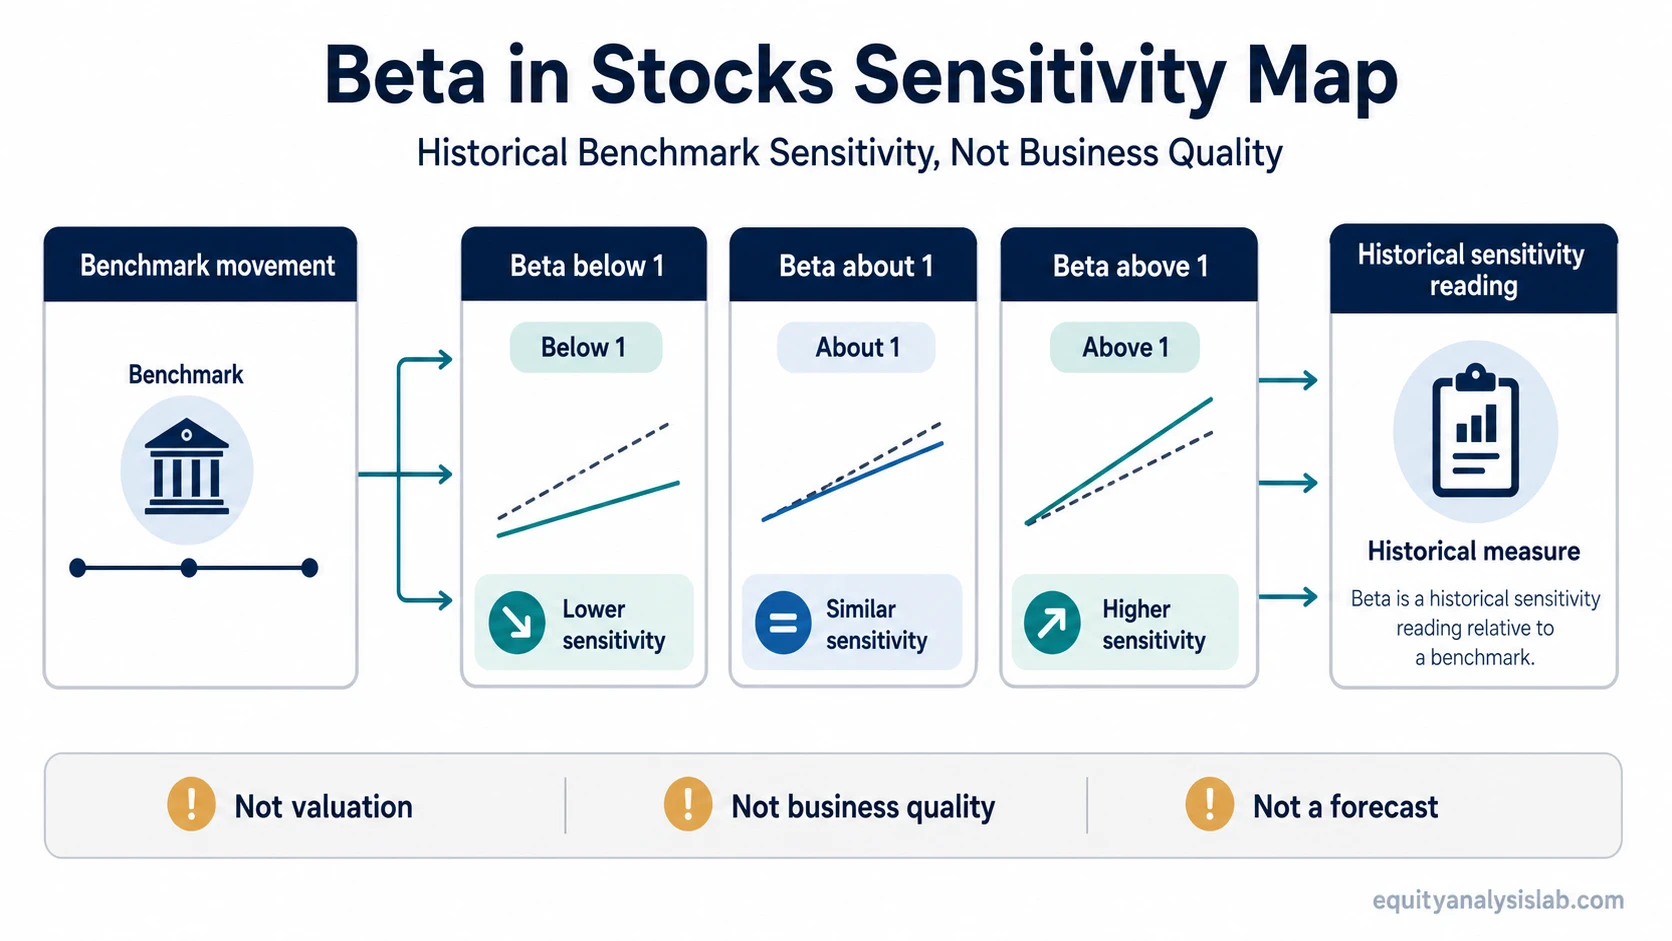
Beta measures how strongly a stock’s returns have historically moved with a chosen market benchmark. A beta around 1 indicates similar market sensitivity, above 1 indicates stronger sensitivity, and below 1 indicates weaker sensitivity.
How to Read Beta Values
| Beta value | Historical interpretation |
|---|---|
| About 1 | The stock has tended to move with roughly similar sensitivity to the benchmark. |
| Above 1 | The stock has tended to respond more strongly to benchmark movements. |
| Below 1 | The stock has tended to respond less strongly to benchmark movements. |
| Near 0 | The stock has shown little historical relationship with the benchmark over the measurement period. |
| Negative | The historical relationship with the benchmark has been inverse over the measurement period. |
Beta vs Total Volatility
A stock can experience large price swings for reasons that have little relationship with the benchmark. Those swings can increase total volatility without creating the same increase in beta.
Measures historical sensitivity to a chosen benchmark and is used as a measure of systematic market risk in CAPM.
Describes the overall variation in the stock’s returns, including market-related and company-specific movement.
How Stock Beta Is Calculated
Beta is estimated from historical returns by dividing the covariance between the stock and benchmark returns by the variance of the benchmark returns.
Beta = Covariance(stock returns, benchmark returns) ÷ Variance(benchmark returns)
The reported number can change when the benchmark, lookback period, return frequency, or calculation method changes. A beta estimated from several years of monthly returns therefore may differ from one estimated from a shorter period of daily or weekly returns.
Beta, CAPM, and Required Return
Beta enters the capital asset pricing model as the measure of systematic market risk. That relationship connects beta to assumptions used in a company’s cost of capital and the investor’s required return. Those pages own the deeper valuation framework; beta provides the market-sensitivity input.
Where Beta Can Mislead
| Reading | What is missing |
|---|---|
| Low beta means the stock is safe | Company-specific risks such as leverage, weak cash generation, business deterioration, or valuation can exist even when market sensitivity is low. |
| High beta means higher future returns | Historical market sensitivity does not establish future performance or investment quality. |
| One beta value is permanent | The estimate can change with the benchmark, time period, return frequency, and the stock’s changing historical relationship with the market. |
| Beta is a forecast of the next market move | The number is estimated from historical co-movement. It does not determine how the stock must react during the next market advance or decline. |