
SaaS customer acquisition cost measures the average sales and marketing cost assigned to each new paying customer acquired during a defined period. The result becomes comparable only when the cost base, customer definition, and measurement period are aligned.
The broader customer acquisition cost concept applies across business models. In SaaS, recurring revenue, sales motion, customer mix, retention, and expansion can change what the same headline CAC means.
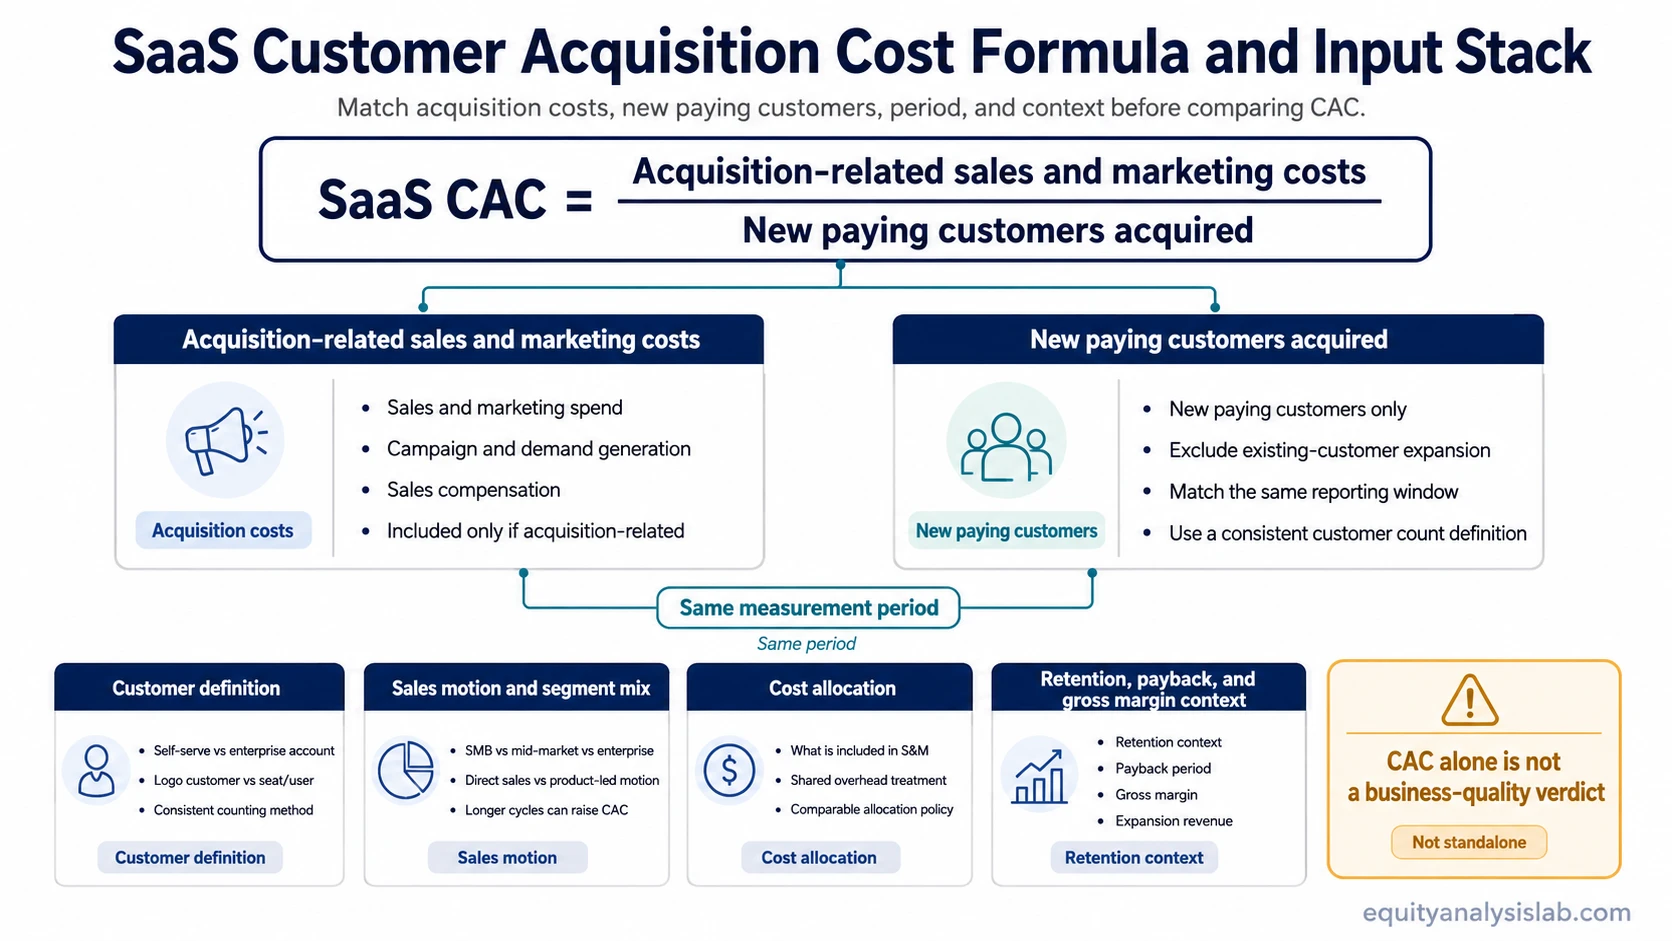
SaaS Customer Acquisition Cost Formula
SaaS CAC = Acquisition-Related Sales and Marketing Costs ÷ New Paying Customers Acquired
Assume a SaaS company records $240,000 of acquisition-related sales and marketing costs during a quarter and acquires 60 new paying customers during the matched measurement period. Its calculated CAC is $4,000 per new customer.
| Formula input | What to define | Comparison risk |
|---|---|---|
| Cost base | Sales and marketing costs assigned to customer acquisition. A fully loaded calculation can include compensation, commissions, media, tools, agencies, events, and other acquisition-related costs. | A narrower cost definition can produce a lower CAC even when underlying acquisition economics have not improved. |
| New customers | New paying customers acquired under a consistent definition, such as new logos, accounts, or paid subscriptions. | Leads, demos, trials, signups, retained customers, and existing-account expansion should not silently enter a new-customer denominator. |
| Measurement period | The time window applied to both the cost base and customer acquisitions. | Long sales cycles can create a lag between acquisition spending and the customers eventually won. |
| Customer mix | The segments and sales motions represented in the customer count. | Self-serve, SMB, mid-market, and enterprise customers can require very different acquisition processes and spending levels. |
New CAC vs Blended CAC
The labels are useful only when the underlying methodology is clear. A figure focused on new-logo acquisition should not be compared directly with one that also reflects activity around existing accounts, expansion, or a different allocation of sales and marketing costs.
Focuses on spending and customer counts associated with newly acquired customers.
Uses a broader measurement approach, so the included customer activity and cost allocation need to be checked before comparison.
Same CAC, Different Acquisition Economics
| Observation | Company A | Company B |
|---|---|---|
| Reported CAC | Same as Company B | Same as Company A |
| Customer retention | Customers remain for longer periods. | Customers leave sooner. |
| Recovery of acquisition spend | Customer gross profit recovers the acquisition cost more quickly. | Recovery takes longer and may be interrupted by churn. |
| Expansion | Retained customers add seats, usage, or products. | Expansion from retained customers is limited. |
| Investor reading | The acquisition cost is supported by stronger customer economics if the pattern persists. | The identical headline CAC carries weaker economics when customer durability and recovery are worse. |
Limits of SaaS CAC Comparisons
Cost allocation, sales motion, customer segment, contract size, sales-cycle length, acquisition channel, and retention profile can all change the interpretation. A product-led self-serve company and an enterprise sales-led company may report very different CAC levels without the lower number automatically representing the stronger business model.
Related SaaS Metrics
| Metric | Question it adds | Reference |
|---|---|---|
| CAC payback | How long does customer gross profit take to recover acquisition spending? | CAC payback period |
| Customer churn | Do acquired customers remain long enough for the acquisition economics to hold? | SaaS churn rate |
| Sales efficiency | How effectively is sales and marketing spending translating into recurring-revenue growth? | SaaS Magic Number |