SaaS Magic Number compares incremental recurring revenue with sales and marketing spend to estimate how efficiently a SaaS company is turning commercial investment into recurring revenue growth.
It is a sales-efficiency ratio, not a proof of company quality, profitability, product-market fit, valuation support, stock safety, or investment attractiveness. A high result can still be weak if churn is elevated, gross margins are thin, the sales cycle is changing, or reported revenue inputs are only rough proxies for true recurring revenue movement.
Definition: SaaS Magic Number is a SaaS sales-efficiency metric that compares recurring revenue growth from one period to sales and marketing spend from a prior period. Analysts use it to judge whether customer acquisition spending appears to be producing enough recurring revenue growth to justify closer business-model analysis.
Key Points
- SaaS Magic Number is commonly used to evaluate sales efficiency in recurring-revenue software businesses.
- The formula usually compares annualized recurring revenue growth with prior-period sales and marketing expense.
- The numerator can vary because companies may report ARR, MRR, subscription revenue, or GAAP revenue differently.
- Benchmark bands are rough context tools, not universal rules.
- The ratio should be read with churn, retention, gross margin, sales-cycle length, revenue mix, and peer context.
SaaS Magic Number Formula
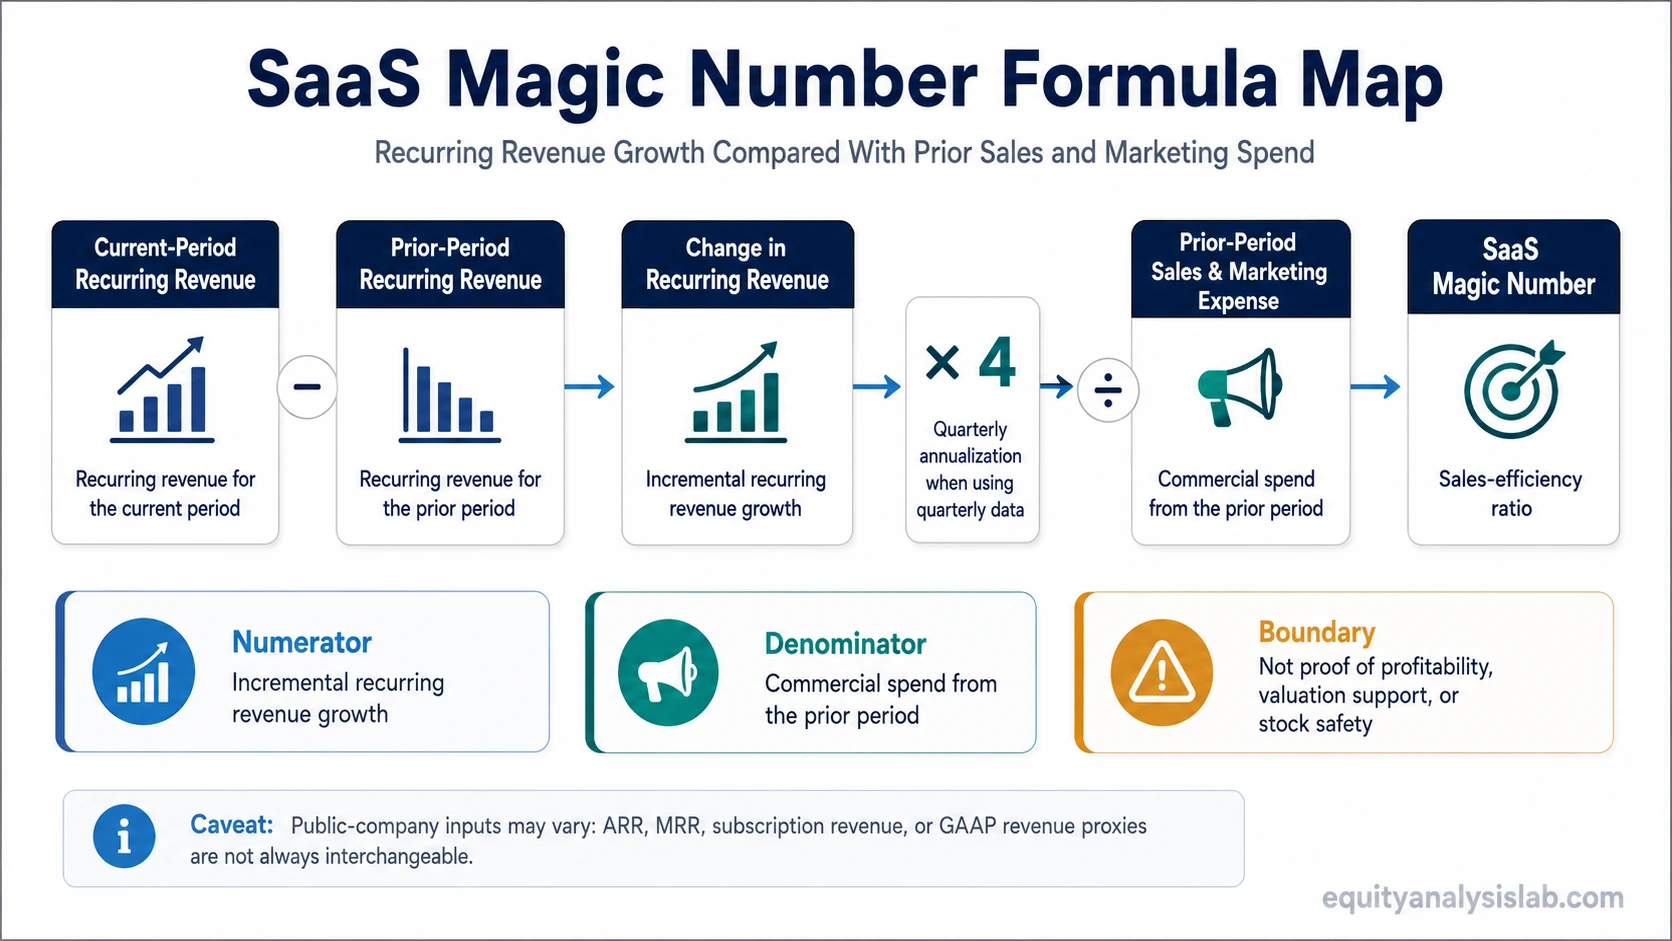
A common SaaS Magic Number formula uses the change in recurring revenue, annualizes that change, and divides it by sales and marketing spend from the prior period.
Common formula: SaaS Magic Number = (Current-period recurring revenue minus prior-period recurring revenue) × 4 ÷ prior-period sales and marketing expense.
The multiplier of 4 is commonly used when quarterly recurring revenue growth is being annualized. For annual data, the calculation may not need the same quarterly annualization step. The important point is period matching: the revenue growth being measured should be compared with the sales and marketing spend that plausibly helped create it.
| Formula part | What it means | Investor caveat |
|---|---|---|
| Current-period recurring revenue | The recurring revenue base at the end of the measured period. | Reported ARR or MRR may be unavailable for some public companies, so analysts may need a proxy. |
| Prior-period recurring revenue | The recurring revenue base from the prior comparable period. | The comparison should use the same revenue definition as the current-period input. |
| Change in recurring revenue | The incremental recurring revenue added during the period. | Expansion, new customers, contraction, and churn can affect the movement differently. |
| Annualization factor | A quarterly revenue change is often multiplied by 4. | Annualization can be misleading when seasonality, contract timing, or sales cycles are uneven. |
| Prior-period sales and marketing expense | The commercial spend used as the denominator. | The timing of sales spend and revenue recognition may not line up perfectly. |
How to Calculate SaaS Magic Number
Assume a SaaS company reports $50 million of recurring revenue in the current quarter and $45 million in the prior quarter. The quarterly increase is $5 million. If prior-quarter sales and marketing expense was $20 million, the quarterly version of the calculation would be:
Hypothetical calculation: (($50 million – $45 million) × 4) ÷ $20 million = $20 million ÷ $20 million = 1.0.
A result of 1.0 means the company generated one dollar of annualized recurring revenue growth for each dollar of prior-period sales and marketing expense in this simplified example. That does not mean the company earned one dollar of profit, recovered customer acquisition cost immediately, or created durable shareholder value.
The denominator is closely related to SaaS customer acquisition cost, but the two concepts are not identical. CAC focuses on the cost of acquiring customers, while SaaS Magic Number focuses on the apparent recurring revenue output from sales and marketing spend.
Formula Inputs and Reporting Choices
The cleanest version of the metric uses recurring revenue measures that directly represent the SaaS revenue base. Public-company disclosures are not always that clean. Some companies disclose ARR or MRR. Others emphasize subscription revenue, remaining performance obligations, billings, or GAAP revenue. Those inputs can point in the same direction, but they are not interchangeable.
| Input choice | Why analysts may use it | Main limitation |
|---|---|---|
| ARR | Often closest to annualized recurring revenue scale. | ARR is a non-GAAP operating metric and may be defined differently by different companies. |
| MRR | Useful when monthly recurring revenue is disclosed and period movement is clear. | Monthly movement can be noisy if contract timing or upgrades are uneven. |
| Subscription revenue | May be available when ARR or MRR is not disclosed. | It may reflect recognized revenue rather than the full forward recurring revenue base. |
| GAAP revenue | Often available in public filings and financial statements. | GAAP revenue can include services, implementation, usage, or timing effects that blur recurring-revenue growth. |
| Billings or bookings proxy | Sometimes used to estimate commercial momentum. | Billing timing and contract structure can distort the relationship with recurring revenue. |
Public-company caveat: When ARR or MRR is not disclosed, SaaS Magic Number becomes more approximate. The calculation may still be useful as a directional screen, but input consistency matters more than false precision.
How Investors Interpret SaaS Magic Number
Investors usually read SaaS Magic Number as a growth-efficiency signal. A stronger ratio can suggest that sales and marketing spend is translating into recurring revenue growth more efficiently. A weaker ratio can suggest that growth requires heavier commercial spending, that revenue conversion is slowing, or that the reported input base is not capturing the business cleanly.
Investor interpretation boundary: SaaS Magic Number is most useful as a starting point for questions about sales efficiency. It becomes more informative when paired with retention, gross margin, revenue mix, sales-cycle length, and peer comparison. It becomes less useful when treated as a standalone verdict.
The ratio can also influence how investors frame growth quality in relation to SaaS valuation multiples. Efficient recurring revenue growth may support a stronger business-quality discussion, but the metric does not determine valuation on its own.
A business can show a strong Magic Number while still facing margin pressure, weak free cash flow, high dilution, customer concentration, aggressive revenue recognition, or limited durability. The ratio answers one question about revenue output from commercial spend. It does not answer the full investment question.
SaaS Magic Number Benchmarks and Context
Many SaaS discussions use rough benchmark bands. A result below 0.5 is often read as weak sales efficiency, a result around 0.75 is sometimes read as improving or acceptable, and a result around 1.0 or higher is often read as strong. These bands are only rules of thumb, not universal standards.
| Approximate result | Common interpretation | Required caveat |
|---|---|---|
| Below 0.5 | Revenue growth may be weak relative to sales and marketing spend. | Early-stage, enterprise-sales, or transition periods can temporarily depress the ratio. |
| 0.5 to 0.75 | Efficiency may be mixed or improving. | Trend direction and peer comparison matter more than the isolated number. |
| 0.75 to 1.0 | Often read as reasonably efficient growth. | Margin structure, churn, and expansion revenue still need separate review. |
| Above 1.0 | Often read as strong sales efficiency. | A high result can reflect timing, low spend, expansion-heavy revenue, or unsustainably favorable comparisons. |
The safest comparison is usually against the same company over time and against similar SaaS companies with comparable sales models, customer size, contract duration, gross margin, and reporting definitions.
When SaaS Magic Number Can Mislead
SaaS Magic Number can create false comfort when it is separated from retention and customer quality. A company can add recurring revenue efficiently in the short term while losing customers, relying on expansion from a narrow base, or accepting weaker customer economics.
False-comfort risk: A high SaaS Magic Number does not automatically mean that revenue is durable. Weak SaaS churn rate, low gross margin, unusual contract timing, heavy one-time services revenue, or a lengthening sales cycle can make the same ratio less impressive.
| Risk factor | How it can distort the reading |
|---|---|
| Churn and contraction | New recurring revenue may look efficient while existing customers are shrinking or leaving. |
| Gross margin | Revenue growth with low gross margin may not translate into strong economic value. |
| Sales-cycle timing | Sales expense may occur before revenue appears, or revenue may appear after unusually delayed spend. |
| Revenue mix | Services, usage revenue, implementation fees, or non-recurring items can blur recurring-revenue growth. |
| Peer mismatch | SMB, enterprise, consumption-based, and vertical SaaS models can have different sales-efficiency profiles. |
The common mistake is treating a single benchmark as a verdict. A better interpretation asks whether the ratio is improving, whether the inputs are consistent, and whether the recurring revenue being added is likely to persist.
SaaS Magic Number vs Related SaaS Metrics
SaaS Magic Number belongs inside a broader SaaS metrics set, but it should not absorb the job of every related metric. Each metric answers a different analytical question.
| Metric | Main question | Relationship to SaaS Magic Number |
|---|---|---|
| SaaS Magic Number | How efficiently is commercial spend turning into recurring revenue growth? | Core sales-efficiency ratio for the current concept. |
| CAC payback | How long does it take to recover customer acquisition cost? | More directly tied to recovery period and contribution economics. |
| Net revenue retention | How much revenue remains from the existing customer base after expansion, contraction, and churn? | Helps explain whether growth is durable inside the existing customer base. |
| Gross revenue retention | How much recurring revenue is retained before expansion? | Helps separate retention quality from expansion-driven growth. |
| Rule of 40 | How does growth compare with profitability or free cash flow margin? | Broader growth-profitability balance, not a sales-efficiency formula. |
The cleanest analysis keeps these metrics separate. SaaS Magic Number can flag sales-efficiency strength or weakness, while retention metrics, margin metrics, and valuation metrics test whether that efficiency is durable and economically meaningful.
FAQ
What is SaaS Magic Number?
SaaS Magic Number is a sales-efficiency ratio that compares incremental recurring revenue with prior-period sales and marketing spend. It is used to estimate how efficiently a SaaS company turns commercial investment into recurring revenue growth.
What is the SaaS Magic Number formula?
A common formula is current-period recurring revenue minus prior-period recurring revenue, multiplied by 4 for quarterly annualization, then divided by prior-period sales and marketing expense.
What is a good SaaS Magic Number?
Many analysts treat a result around 0.75 to 1.0 as stronger than a low result, but benchmark bands are rough rules of thumb. The right interpretation depends on company stage, sales model, retention, gross margin, revenue mix, and peer context.
Can SaaS Magic Number prove that a SaaS company is attractive?
No. SaaS Magic Number can help analyze sales efficiency, but it does not prove profitability, valuation support, revenue durability, product-market fit, stock safety, or investment attractiveness.