
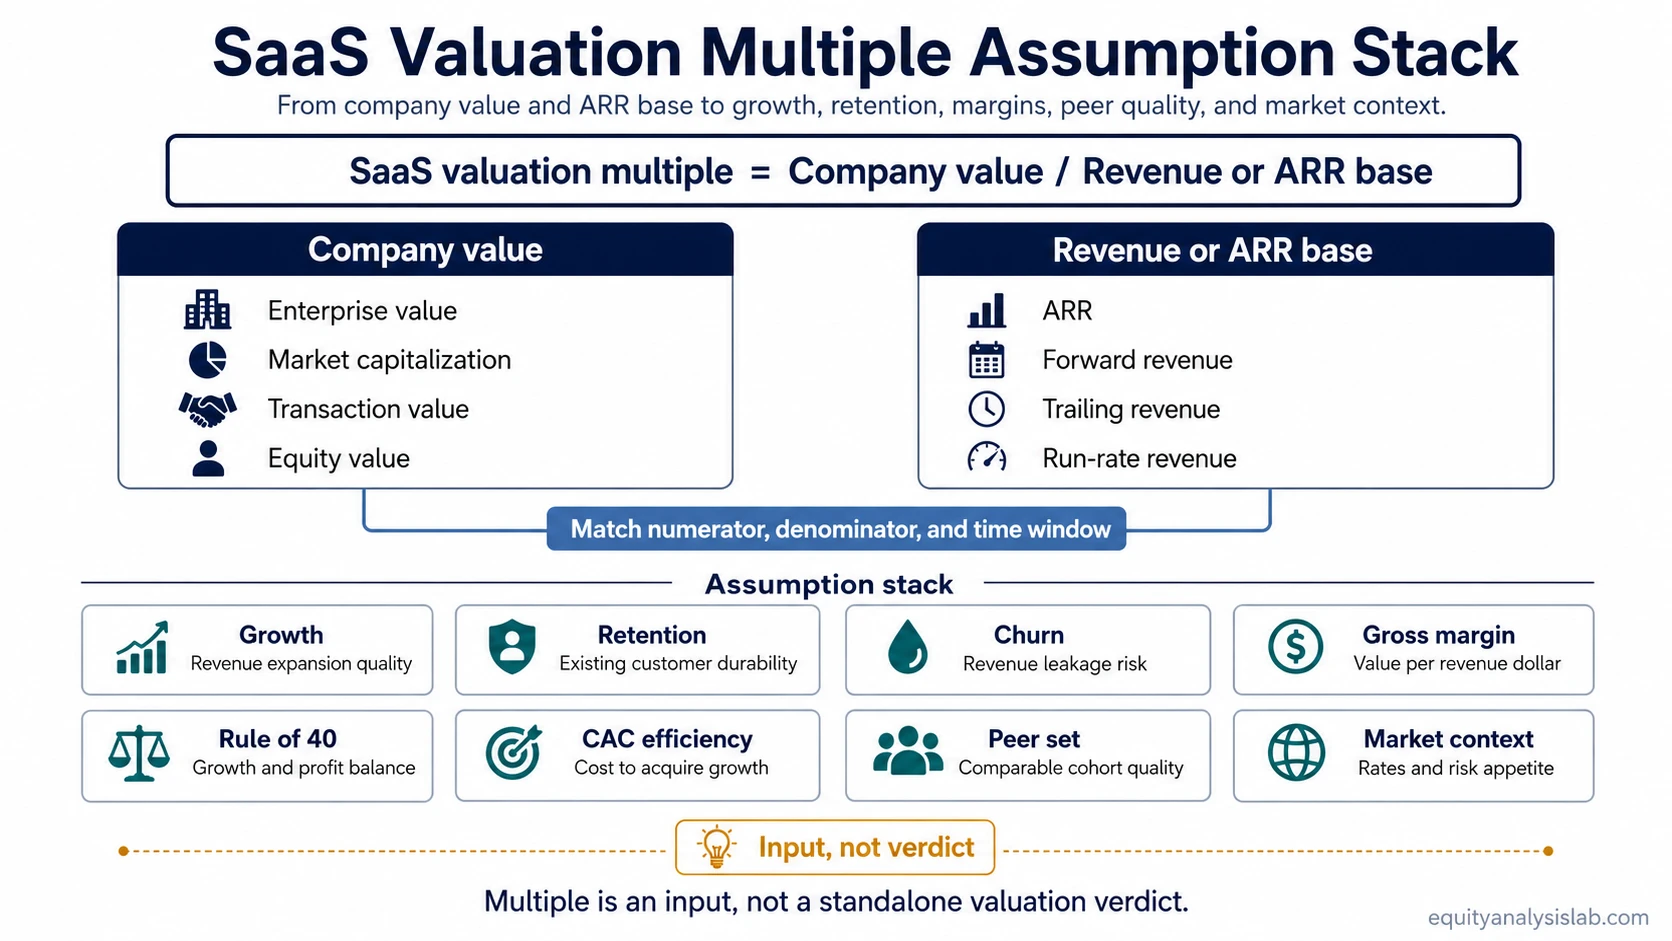
SaaS valuation multiples compare a software company’s value with a revenue base such as annualized revenue, forward revenue, or ARR. The ratio is useful only when the numerator, denominator, time period, and peer set are defined consistently.
For SaaS investors, the multiple is best treated as a pricing reference rather than a valuation conclusion. Growth, retention, gross margin, sales efficiency, profitability, and market conditions can change what the same headline multiple means.
Current SaaS Multiple Context
The SaaS Capital Index is updated monthly and, as of August 31, 2026, covers 63 publicly traded B2B SaaS companies. Its index multiple uses market capitalization divided by annualized current run-rate GAAP revenue rather than enterprise value divided by reported ARR. A current reconciliation of the August 31 data reports a 4.6x median. The figure is a market anchor for that methodology and date, not a universal SaaS valuation multiple.
SaaS Capital’s 2026 private-company valuation research also treats market conditions, ARR growth, and net revenue retention as separate inputs. That supports using a current market benchmark as a starting reference while keeping company-specific growth and revenue quality separate from the benchmark itself.
How SaaS Valuation Multiples Are Calculated
Basic structure: SaaS valuation multiple = company value ÷ revenue or ARR base
An ARR multiple uses annual recurring revenue as the denominator. Public-market comparisons can also use trailing revenue, forward revenue, or annualized current run-rate revenue. The numerator may be enterprise value, market capitalization, or transaction value depending on the convention and the question being answered.
| Multiple convention | Numerator | Denominator | Comparison boundary |
|---|---|---|---|
| EV / Revenue | Enterprise value | Trailing, forward, or run-rate revenue | The revenue period must match across peers. |
| EV / ARR | Enterprise value | ARR | ARR definitions can differ across companies. |
| Market Cap / Run-Rate Revenue | Market capitalization | Annualized current run-rate revenue | This is a different convention from EV / ARR and should not share the same benchmark automatically. |
| Transaction Multiple | Deal or transaction value | Revenue or ARR used in the transaction analysis | Deal structure, control value, and buyer-specific terms can affect the result. |
If a company has an enterprise value of $800 million and ARR of $100 million, its EV / ARR multiple is 8x. That calculation states the pricing ratio. It does not establish whether 8x is attractive without comparing growth, retention, margins, efficiency, and the market context used for the peer set.
What Drives SaaS Valuation Multiples
| Driver | Why it changes the reading | What to verify |
|---|---|---|
| Growth | Faster durable growth can support a higher multiple because more future revenue is being priced into the company. | Check whether growth is organic, persistent, and supported by the same revenue definition used in the multiple. |
| net revenue retention | Expansion and contraction inside the existing customer base affect the durability of recurring revenue growth. | Check the company’s definition, customer mix, and reporting consistency. |
| SaaS churn rate | Higher churn can weaken the quality of the revenue base even when headline growth remains positive. | Separate customer churn from revenue churn and review the measurement period. |
| Gross margin | Gross margin affects how much economic value can potentially remain after delivering the service. | Compare software-heavy and services-heavy revenue mixes carefully. |
| Rule of 40 | Growth and profitability together can distinguish efficient growth from growth that requires persistent losses. | Check which profitability measure is being used and whether the comparison is consistent across peers. |
| SaaS customer acquisition cost | Acquisition efficiency affects how expensive it is to create new recurring revenue. | Review CAC with payback, retention, customer size, and sales motion rather than as a standalone input. |
| Peer set and market context | Sector sentiment, discount rates, company size, vertical, and business model can shift the range investors accept. | Use peers with comparable growth, margins, stage, and revenue structure. |
Public and Private SaaS Multiples Are Different Reference Sets
Public multiples reflect continuously traded market prices and standardized public reporting. Private transactions can also reflect control value, buyer synergies, financing terms, deal size, and company-specific diligence. A public SaaS benchmark can provide context for a private company, but transferring it mechanically creates false precision.
Useful for current market sentiment and peer pricing when the numerator, revenue basis, and company set are clearly defined.
Requires adjustments for scale, liquidity, company quality, transaction structure, and the specific revenue base used by the buyer or investor.
Why the Same Multiple Can Mean Different Things
Two SaaS companies can both trade at 8x ARR while carrying very different assumptions. A company with faster growth, stronger retention, high gross margin, and improving operating leverage may be pricing a more durable revenue stream. Another company at the same 8x can have slower growth, higher churn, weak unit economics, or a less credible path to profitability.
The headline ratio does not reveal those differences. The multiple compresses several expectations into one number, so the interpretation has to return to the quality and cost of the revenue being valued.
Limits of SaaS Valuation Multiples
A low multiple can reflect weaker growth, retention, margins, customer concentration, or market confidence rather than undervaluation. A high multiple can reflect strong business quality or aggressive expectations. Revenue multiples also become less informative as earnings and cash flow become more stable, because mature companies can be evaluated with a broader set of valuation measures.
How SaaS Multiples Fit Broader Valuation Work
SaaS multiples belong inside broader valuation multiples analysis. The sector-specific ratio helps normalize software companies when recurring revenue is central to the business model, while broader valuation work can also incorporate price-to-sales, EV/revenue, earnings, free cash flow, margins, and company-specific risk.
A useful comparison checks whether the chosen multiple uses a comparable convention, reflects a similar business model, and remains consistent with the company’s growth quality and path to cash generation.