Net revenue retention measures how much recurring revenue a company keeps from its existing customer base after expansion, contraction, and churn. It excludes new customer revenue, so it can help investors analyze recurring revenue quality without confusing retention with total growth.
NRR is most common in SaaS and subscription business analysis. A high figure can point to expansion inside the customer base, but it does not prove business quality, valuation support, stock safety, or future returns on its own.
Key Points
- Net revenue retention measures existing-customer recurring revenue after expansion, contraction, and churn.
- New customer revenue is excluded, which separates NRR from total revenue growth.
- NRR includes expansion revenue, while GRR excludes expansion.
- High NRR can still hide churn, customer concentration, pricing effects, or inconsistent disclosures.
- Investors should read NRR across time, peer group, contract model, customer mix, and company definitions.
What Net Revenue Retention Measures
Net revenue retention is the percentage of starting recurring revenue retained from the same customer base after adding expansion revenue and subtracting contraction and churn.
The same-customer boundary is the core of the metric. NRR does not ask whether the company added new customers. It asks whether the revenue base that already existed at the beginning of the period grew, stayed flat, or shrank after upsells, cross-sells, downgrades, and lost customers.
For investors, that boundary matters because total revenue growth can come from new sales even when existing-customer retention is weakening. NRR narrows the view to the recurring revenue base already inside the business.
Net Revenue Retention Formula
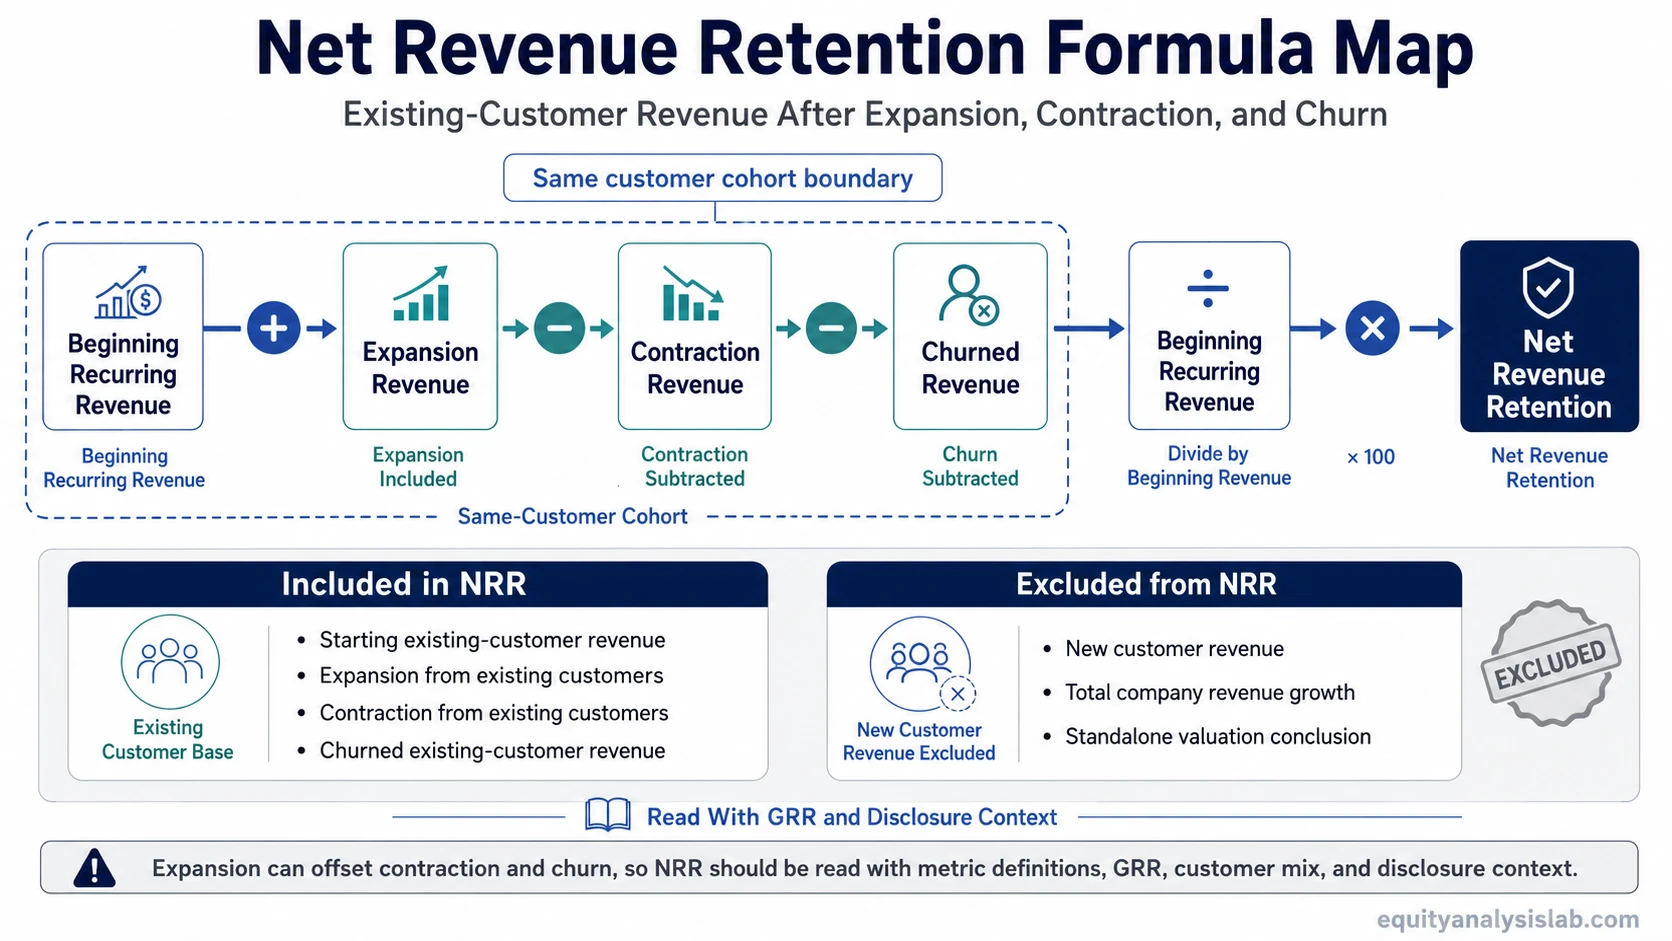
Net revenue retention formula:
NRR = (Beginning Recurring Revenue + Expansion Revenue – Contraction Revenue – Churned Revenue) / Beginning Recurring Revenue × 100
The denominator is the recurring revenue from the starting customer base. The numerator adjusts that same base for expansion, contraction, and churn during the measurement period. The formula should not include recurring revenue from customers acquired after the starting point.
| Formula input | What it means | Effect on NRR |
|---|---|---|
| Beginning recurring revenue | Recurring revenue from the starting customer base at the beginning of the period. | Denominator and baseline. |
| Expansion revenue | Additional recurring revenue from existing customers through upgrades, seat growth, cross-sells, or usage expansion. | Increases NRR. |
| Contraction revenue | Lost recurring revenue from existing customers that downgrade, reduce usage, or lower contract value. | Reduces NRR. |
| Churned revenue | Recurring revenue lost when existing customers leave entirely. | Reduces NRR. |
| New customer revenue | Recurring revenue from customers added after the start of the period. | Excluded from NRR. |
What Counts in NRR and What Does Not
NRR is a same-customer metric. The measurement set should start with customers that existed at the beginning of the period and then track the recurring revenue changes inside that group.
| Revenue item | Included in NRR? | Reason |
|---|---|---|
| Seat expansion from an existing customer | Yes | It increases recurring revenue from the starting customer base. |
| Upgrade to a higher plan by an existing customer | Yes | It is expansion revenue inside the same customer cohort. |
| Downgrade by an existing customer | Yes, as a reduction | It is contraction revenue inside the starting customer base. |
| Cancellation by an existing customer | Yes, as churn | It removes recurring revenue from the starting customer base. |
| Revenue from a new customer | No | It belongs to new sales growth, not same-customer retention. |
| One-time implementation or services revenue | Usually no | NRR is normally based on recurring revenue, not one-time revenue. |
Company definitions can vary. Some companies use ARR, some use MRR, some use subscription revenue, and some use annual contract value or a disclosed recurring-revenue base. Investors should read the metric definition before comparing one company’s NRR with another company’s NRR.
Net Revenue Retention Calculation Example
Assume a SaaS company starts the year with $10 million of recurring revenue from existing customers. During the year, those same customers add $2 million of expansion revenue, reduce spending by $700,000, and churn $500,000 of recurring revenue.
Example calculation:
Beginning recurring revenue: $10,000,000
Expansion revenue: $2,000,000
Contraction revenue: $700,000
Churned revenue: $500,000
NRR = ($10,000,000 + $2,000,000 – $700,000 – $500,000) / $10,000,000 × 100
NRR = 108%
In this example, the existing customer base produced more recurring revenue at the end of the period than it did at the start. That does not mean every customer stayed or expanded. It means expansion revenue from the remaining customer base more than offset contraction and churn inside the measured cohort.
Net Revenue Retention vs Gross Revenue Retention
Gross revenue retention measures how much recurring revenue remains from existing customers before expansion revenue. Net revenue retention includes expansion revenue. That is the central difference.
| Metric | Expansion revenue included? | Main question answered |
|---|---|---|
| Net revenue retention | Yes | Did the existing customer base expand or shrink after expansion, contraction, and churn? |
| Gross revenue retention | No | How much of the starting recurring revenue base was retained before expansion? |
NRR can be above 100% when expansion exceeds contraction and churn. GRR cannot exceed 100% because it excludes expansion revenue. For investor analysis, the two metrics are more useful together than separately.
| Pattern | Possible interpretation | Investor caution |
|---|---|---|
| High NRR and high GRR | Existing customers are both staying and expanding. | Still check margin quality, disclosure definitions, and customer concentration. |
| High NRR and weak GRR | Expansion may be offsetting churn or downgrades. | Expansion can mask retention pressure. |
| Low NRR and weak GRR | The existing revenue base may be shrinking. | Check whether churn, contraction, or pricing pressure is driving the decline. |
If NRR is strong but GRR is weak, the business may still have meaningful churn pressure. Expansion can offset that pressure in the metric, but it does not remove the need to understand why customers are leaving or reducing spend.
Net Revenue Retention vs Net Dollar Retention, ARR, and MRR
Net dollar retention is often used close to net revenue retention in SaaS disclosures. In many contexts the terms describe a similar same-customer revenue-retention idea, but investors should read the company’s definition instead of assuming perfect interchangeability.
Annual recurring revenue describes annualized recurring revenue scale. NRR describes how the starting recurring revenue base changed after expansion, contraction, and churn. A company can grow ARR through new customers even if same-customer retention is weakening.
Monthly recurring revenue shows monthly recurring revenue movement. NRR can be calculated from a recurring revenue base, but the analytical question is different: MRR shows revenue scale and movement, while NRR isolates retention and expansion inside an existing cohort.
| Metric | Primary role | Common investor use |
|---|---|---|
| NRR | Same-customer retention after expansion, contraction, and churn. | Analyze whether the existing revenue base is expanding or shrinking. |
| NDR | Often similar to NRR, depending on company definition. | Read company-specific definitions before comparison. |
| ARR | Annualized recurring revenue scale. | Measure recurring revenue size and growth base. |
| MRR | Monthly recurring revenue scale and movement. | Track shorter-period recurring revenue changes. |
| GRR | Retention before expansion. | Separate customer-base durability from upsell strength. |
How Investors Interpret Net Revenue Retention
NRR can help investors judge whether a SaaS company is growing inside its existing customer base. A figure above 100% means expansion revenue from existing customers exceeded contraction and churn during the measured period. A figure below 100% means the starting revenue base shrank after those adjustments.
The stronger reading is not simply “higher is better.” Investors need to ask what created the number. Expansion can come from more seats, higher usage, cross-sells, pricing changes, product bundling, or contract structure. Each source has a different implication for durability.
| NRR driver | What to examine | Why it matters |
|---|---|---|
| Seat expansion | Whether customers are adding users naturally or only during one-time implementation waves. | Durability may differ by adoption pattern. |
| Usage growth | Whether usage-based revenue is stable or cyclical. | Usage expansion can reverse if customer activity slows. |
| Price increases | Whether higher prices are accepted without increasing churn. | Pricing power can be valuable, but aggressive increases may pressure retention later. |
| Cross-sell | Whether customers adopt additional products because of real workflow value. | Cross-sell can strengthen account depth if adoption is durable. |
| Customer concentration | Whether a few large customers drive most of the expansion. | Concentration can make NRR less stable across periods. |
Limitations and Common Mistakes
NRR is useful, but it is not a complete business-quality score. It can look strong while churn pressure, margin pressure, customer concentration, or disclosure inconsistency remains unresolved.
Common mistake: treating high NRR as proof that a SaaS company is high quality. NRR can support the analysis, but it does not prove valuation support, stock safety, margin durability, cash-flow quality, or future returns.
| Limitation | Why it matters | Investor check |
|---|---|---|
| Expansion can hide churn | Large upsells can offset lost customers in the net metric. | Compare NRR with GRR and customer count trends. |
| Definitions vary | Companies may use different recurring revenue bases, periods, or cohort rules. | Read the disclosed definition before peer comparison. |
| NRR does not show margin quality | Revenue expansion may require high support, sales, or infrastructure cost. | Compare retention with gross margin, operating margin, and cash flow. |
| Customer concentration can distort results | A few large accounts can drive reported retention. | Check enterprise mix, top-customer exposure, and segment disclosure. |
| Period selection matters | Annual, quarterly, and trailing-period metrics may show different retention behavior. | Track the same definition across time. |
Public Company Disclosure and Comparability
Public SaaS companies do not always disclose NRR in the same way. Some disclose dollar-based net retention, some disclose net expansion rate, and some stop disclosing the metric after a business mix changes. Others define the customer cohort, revenue base, or measurement period differently.
That makes comparability an investor judgment, not a mechanical ranking exercise. A peer comparison is more reliable when the companies have similar contract lengths, customer sizes, pricing models, product maturity, and disclosure definitions.
Disclosure check: before comparing NRR across companies, confirm the revenue base, customer cohort, time period, treatment of expansion, treatment of churn, and whether the metric is calculated from ARR, MRR, subscription revenue, or another recurring-revenue definition.
Where NRR Fits in SaaS Company Analysis
NRR sits between revenue scale metrics and customer-retention metrics. It does not replace ARR, MRR, GRR, margin analysis, cash-flow analysis, or valuation work. Its main role is to show whether the existing recurring revenue base is expanding or shrinking after customer-base movements.
A stronger investor reading combines NRR with customer mix, pricing model, contract duration, renewal behavior, margin structure, and disclosure consistency. That broader context helps prevent a single retention metric from carrying more meaning than the evidence supports.
FAQ
What is net revenue retention?
Net revenue retention is the percentage of recurring revenue retained from existing customers after expansion, contraction, and churn. It excludes revenue from new customers added during the period.
What is the net revenue retention formula?
The formula is beginning recurring revenue plus expansion revenue minus contraction revenue minus churned revenue, divided by beginning recurring revenue, multiplied by 100.
Does net revenue retention include new customers?
No. Net revenue retention excludes new customer revenue because it measures changes inside the existing customer base.
Is NRR the same as gross revenue retention?
No. Gross revenue retention excludes expansion revenue, while net revenue retention includes expansion from existing customers.
Does high NRR prove a SaaS company is high quality?
No. High NRR can support retention-quality analysis, but it does not prove business quality, valuation support, stock safety, or future returns by itself.