SaaS metrics are measurements used to interpret recurring revenue, retention, acquisition efficiency, growth discipline, and valuation context in software subscription businesses.
Different metrics answer different company-analysis questions. Revenue metrics describe scale, retention metrics test the durability of that revenue, acquisition metrics show the cost of adding customers, and valuation metrics require context from growth, margins, cash flow, and market expectations.
Definition: SaaS metrics are business-model measurements used to analyze subscription revenue, customer retention, expansion, acquisition efficiency, profitability balance, and valuation context. They help organize the analysis, but they do not prove business quality, investment attractiveness, or future returns by themselves.
Key Points
- ARR and MRR describe recurring revenue scale, but they do not show whether customers are staying, expanding, or leaving.
- GRR, NRR, and churn separate retained revenue, expansion revenue, and lost revenue.
- CAC, CAC payback, and SaaS Magic Number help test whether growth is being bought efficiently.
- Rule of 40 connects growth and profitability discipline, but it still depends on margins, cash conversion, and business maturity.
- SaaS valuation multiples require context from revenue quality, retention, growth, margins, disclosure quality, and market conditions.
What SaaS Metrics Measure
SaaS metrics organize subscription businesses around recurring revenue, customer relationships, acquisition costs, expansion behavior, profitability trade-offs, and valuation context. The analytical value comes from matching the metric to the question being asked.
A company can report strong recurring revenue growth while retention weakens, acquisition costs rise, margins compress, or customer concentration increases. That is why SaaS metrics work best as a sequence of checks rather than as a single score.
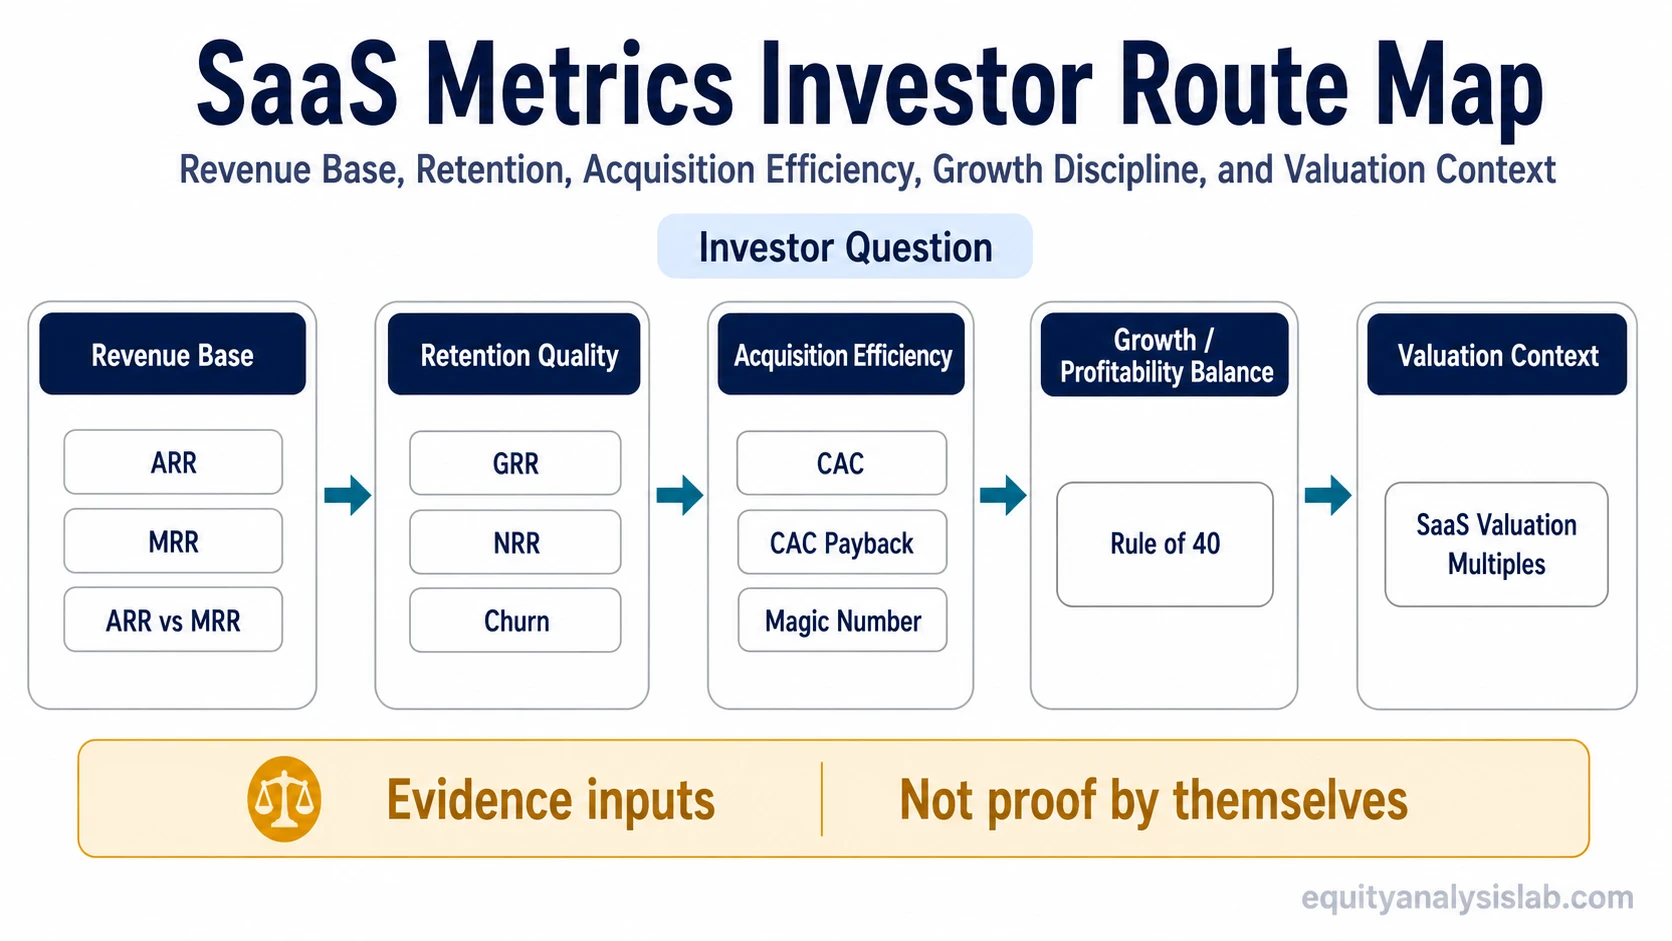
SaaS Metrics Investor Route Map
The strongest starting point depends on the analytical question. Revenue scale, retention quality, acquisition efficiency, profitability balance, and valuation context should be separated before drawing conclusions from any one metric family.
| Investor question | Metric family | Start with | What it helps test | What still needs context |
|---|---|---|---|---|
| How large is the recurring revenue base? | Revenue base | annual recurring revenue | Annualized subscription revenue scale and recurring revenue base. | Retention quality, cash conversion, margin durability, and valuation context. |
| How much recurring revenue is visible at a monthly level? | Revenue base | monthly recurring revenue | Current monthly recurring revenue run-rate and shorter-period revenue movement. | Annual durability, renewal quality, and customer profitability. |
| Are revenue scale and monthly run-rate being confused? | Revenue comparison | ARR vs MRR | The difference between annualized recurring revenue scale and monthly recurring revenue flow. | Whether the revenue is profitable, retained, or fairly valued. |
| How much revenue is retained before expansion? | Retention quality | gross revenue retention | How much existing recurring revenue remains before upsells or expansion are included. | Expansion strength, acquisition efficiency, and total growth quality. |
| Does expansion offset downgrades and churn? | Retention and expansion | net revenue retention | Whether existing customers are expanding enough to offset contraction and lost revenue. | New customer acquisition quality, margin strength, and valuation discipline. |
| How much customer or revenue loss is affecting the base? | Retention risk | SaaS churn rate | Customer or revenue loss that can weaken recurring revenue durability. | Remaining-customer profitability and new-growth efficiency. |
| How costly is new customer acquisition? | Acquisition efficiency | SaaS customer acquisition cost | The sales and marketing cost required to acquire customers. | Payback speed, customer lifetime economics, and retention durability. |
| How quickly does acquisition spend come back through gross profit? | Acquisition efficiency | CAC payback period | The time needed for customer gross profit to recover acquisition cost. | Long-term retention, expansion quality, and valuation fairness. |
| Is sales efficiency improving or weakening? | Sales efficiency | SaaS Magic Number | How effectively sales and marketing spend translates into recurring revenue growth. | Profitability quality, cohort durability, and customer concentration risk. |
| Is growth balanced against profitability? | Growth and profitability | Rule of 40 | The combined relationship between growth rate and profitability margin. | Accounting quality, cash conversion, valuation attractiveness, and future return potential. |
| How should valuation context be framed? | Valuation context | SaaS valuation multiples | How the market prices SaaS revenue, growth, profitability, retention, and risk. | Intrinsic value, buy/sell timing, and whether the multiple is justified without deeper analysis. |
Revenue Base Metrics
Revenue base metrics answer a scale question first. Annual recurring revenue annualizes recurring subscription revenue and is useful when comparing the size of the subscription base across companies or periods.
Monthly recurring revenue focuses on current recurring revenue at a monthly level. It can make recent changes easier to see, but it should not be treated as proof that the annual revenue base is durable.
The ARR vs MRR distinction matters when annualized revenue scale and current monthly revenue flow are being compared. The difference is especially important when billing cadence, recent customer additions, downgrades, or cancellations affect interpretation.
Retention Quality Metrics
Retention metrics move the analysis from revenue size to revenue durability. Gross revenue retention focuses on how much recurring revenue remains before expansion is counted, which makes it useful for checking whether the base is eroding underneath headline growth.
Net revenue retention includes expansion, upgrades, downgrades, and churn inside the existing customer base. High expansion can improve the number, but the underlying mix still matters because expansion can mask weak retention in part of the customer base.
SaaS churn rate helps isolate customer or revenue loss. Churn is especially important when reported growth depends heavily on new customer acquisition, because weak retention can force the business to replace lost revenue before it creates net growth.
Acquisition Efficiency Metrics
Acquisition efficiency metrics test the cost of growth. SaaS customer acquisition cost focuses on the sales and marketing cost required to add customers, but the figure needs context from customer quality, margin structure, and retention.
CAC payback period adds time to the analysis by asking how long it takes to recover acquisition cost through customer gross profit. A shorter payback can be helpful, but weak retention, low gross margins, or poor cash conversion can still weaken the business case.
The SaaS Magic Number connects sales and marketing spend with recurring revenue growth. It is a sales efficiency lens, not a complete business-quality test.
Growth, Profitability, and Valuation Context
The Rule of 40 combines growth and profitability into one high-level balance check. It can help compare companies with different mixes of growth and margin, but it does not replace analysis of gross margin, operating leverage, cash flow, revenue quality, or balance-sheet risk.
SaaS valuation multiples place revenue, growth, margin, retention, and risk into a market-pricing context. A multiple can look high or low only after the business model, growth durability, margin path, cash conversion, and market environment are considered together.
Common Mistakes When Reading SaaS Metrics
Common mistake: Treating one strong SaaS metric as proof that the business is high quality. Strong ARR growth can still coexist with weak retention, expensive acquisition, margin pressure, poor cash conversion, or concentrated customers.
Metric quality depends on stage, cohort mix, customer size, contract structure, revenue recognition, gross margin, and disclosure quality. Public companies may not disclose enough cohort-level or customer-level detail to compare metrics cleanly across businesses.
A stronger analysis checks whether the metric family answers the right question. Revenue scale should be tested against retention. Retention should be tested against acquisition efficiency. Acquisition efficiency should be tested against margin and payback. Valuation should be tested against the full evidence chain, not a single headline metric.
SaaS Metrics Routing Scenario
A SaaS company can show strong recurring revenue growth while retention weakens. In that scenario, ARR or MRR alone is not enough. Retention metrics such as GRR, NRR, and churn usually come before acquisition efficiency or valuation multiples in the reading order, because growth that must constantly replace lost revenue can mean something different from growth that compounds on a stable customer base.
If retention remains strong, acquisition efficiency becomes more useful. If acquisition efficiency is also improving, growth and profitability metrics can add another layer. Valuation context comes last because a multiple is easier to interpret after revenue quality, retention, margins, and growth discipline have been separated.
SaaS Metrics Reading Order
A practical sequence starts with the revenue base, then moves to retention quality, then acquisition efficiency, then profitability balance, and finally valuation context. The order matters because each metric family can change the meaning of the next one.
| Step | Question | Metric family | Interpretation risk |
|---|---|---|---|
| 1 | How large is the recurring revenue base? | ARR and MRR | Scale can look strong before retention quality is tested. |
| 2 | Is existing revenue staying or expanding? | GRR, NRR, and churn | Expansion can mask weaker gross retention. |
| 3 | How expensive is growth? | CAC, CAC payback, and SaaS Magic Number | Growth can be costly even when revenue is rising. |
| 4 | Is growth balanced with profitability? | Rule of 40 and margin context | A combined score can hide weak cash conversion or accounting quality. |
| 5 | How is the market pricing the evidence? | SaaS valuation multiples | A multiple does not determine intrinsic value without deeper analysis. |
SaaS Metrics Limitations
Limitation: SaaS metrics improve business-model interpretation, but they are not automatic evidence of quality, pricing power, valuation support, safety, or future investment returns.
Metric comparability can break down when companies serve different customer segments, sell different contract lengths, recognize revenue differently, disclose cohorts unevenly, or operate at different maturity stages. A smaller high-growth SaaS company and a mature enterprise software company may report similar metric labels while describing different economic realities.
Margins, free cash flow, customer concentration, renewal structure, capitalized costs, and sales efficiency should be read alongside the metric set. A clean SaaS metrics profile is useful, but it still needs support from financial statements, business model quality, and valuation discipline.
FAQ
What are SaaS metrics?
SaaS metrics are measurements used to analyze subscription software businesses, including recurring revenue, retention, churn, acquisition efficiency, profitability balance, and valuation context.
Which SaaS metrics should investors review first?
A useful sequence starts with ARR and MRR, then moves to GRR, NRR, churn, CAC, CAC payback, SaaS Magic Number, Rule of 40, and valuation multiples.
Do strong SaaS metrics prove that a company is attractive?
No. Strong SaaS metrics can improve interpretation, but they do not prove business quality, valuation support, investment attractiveness, or future returns without broader financial and business-model analysis.