Gross revenue retention measures how much recurring revenue a SaaS company keeps from existing customers over a period before counting expansion revenue. It helps investors read churn and downgrade pressure, but it does not prove overall growth quality, valuation support, or investment attractiveness by itself.
Gross revenue retention: the percentage of starting recurring revenue that remains after customer churn and downgrades, before adding expansion, upsell, cross-sell, or price-expansion revenue.
Key Points
- Gross revenue retention focuses on retained recurring revenue from existing customers.
- Customer churn and downgrade or contraction revenue reduce GRR.
- Expansion revenue is excluded, so correctly calculated GRR cannot exceed 100%.
- The revenue base should stay consistent across the calculation, usually ARR or MRR, not a casual mix of both.
- For investors, GRR is a downside retention diagnostic, not a complete SaaS quality score.
What Gross Revenue Retention Measures
Gross revenue retention measures the recurring revenue a SaaS company keeps from the customer base it already had at the start of a period. It isolates downside movement in that base: customers that leave, customers that renew at a smaller contract size, and customers that reduce seats, modules, usage, or plan level depending on the company’s pricing model.
The metric is intentionally conservative because it excludes expansion revenue. A company may sell more to remaining customers, but that additional revenue does not raise GRR. The purpose is to show how much of the starting recurring revenue base stayed intact before growth from upsell or cross-sell is counted.
That makes GRR useful for SaaS analysis, but narrow. It can help investors evaluate retention durability, churn pressure, and downgrade risk, yet it does not show new customer growth, acquisition efficiency, margin quality, free cash flow conversion, or whether the stock price already reflects the company’s strengths.
Gross Revenue Retention Formula
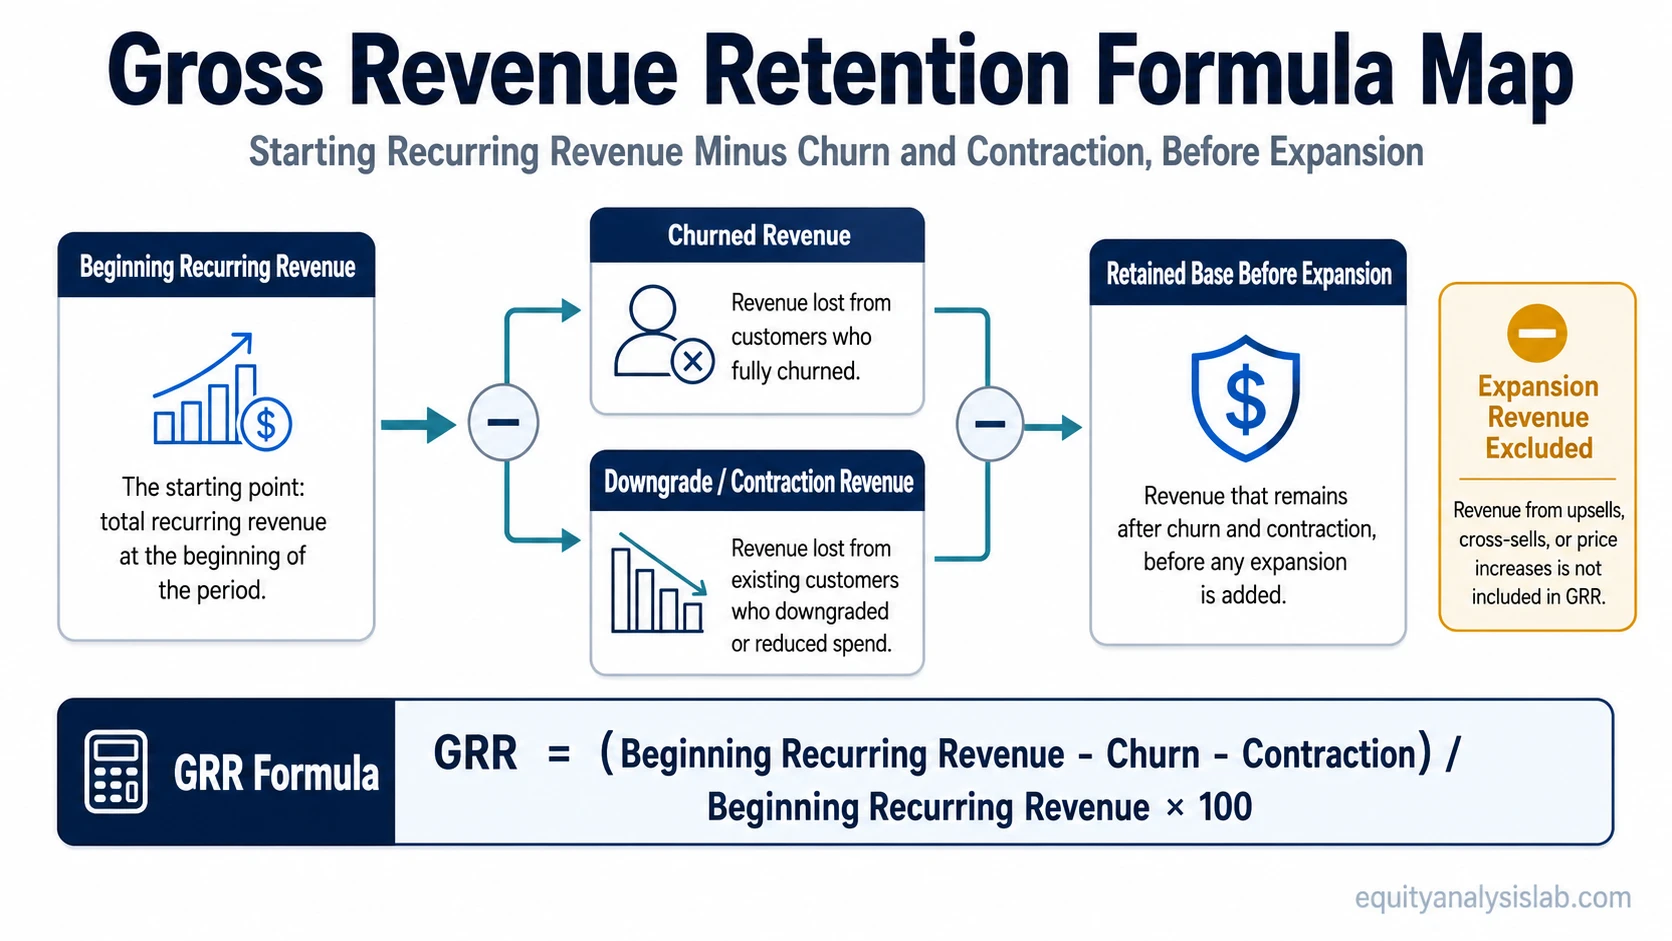
The standard gross revenue retention formula is:
Gross revenue retention = (Beginning recurring revenue – churned recurring revenue – downgrade or contraction recurring revenue) / beginning recurring revenue × 100
Beginning recurring revenue is the starting recurring revenue base for the cohort or customer group being measured. It may be based on annual recurring revenue when the company reports ARR-based retention.
Churned recurring revenue is the recurring revenue lost when customers leave during the measurement period. It reduces GRR because the original customer revenue did not renew.
Downgrade or contraction recurring revenue is the recurring revenue lost when customers stay but spend less than before. This can come from seat reductions, lower-tier plans, smaller usage levels, contract renegotiation, product scope reduction, or lower committed spend.
Expansion revenue is excluded. Upsells, cross-sells, higher usage, additional seats, new modules, and pricing expansion do not increase gross revenue retention. Because expansion is excluded, correctly calculated GRR cannot exceed 100%.
Base consistency matters: a GRR calculation should not mix ARR and MRR casually. If the company starts with an ARR denominator, churn and contraction should be measured on the same ARR basis. If it starts with a monthly recurring revenue base, the losses should be measured on that same MRR basis.
Input Audit Table
Before relying on GRR, investors should check which inputs are actually included and whether the reporting basis is comparable across periods or peers.
| Input | What to Check | Why It Matters |
|---|---|---|
| Beginning recurring revenue | Whether the denominator uses ARR, MRR, committed recurring revenue, or another recurring-revenue base. | The starting base controls the entire ratio. A different denominator can change comparability. |
| Churned recurring revenue | Whether lost customers are measured at prior contract value, expected renewal value, or another reported basis. | Customer exits are the clearest drag on GRR, but definitions can vary. |
| Downgrade or contraction recurring revenue | Whether reductions from seats, usage, modules, plan level, or contract scope are included. | Contraction can reveal pressure even when customers do not fully churn. |
| Measurement period | Whether the company reports monthly, quarterly, annual, trailing, or cohort-based retention. | Different periods can make retention look smoother or more volatile. |
| Expansion revenue | Whether upsell, cross-sell, price increases, usage growth, and added seats are fully excluded. | If expansion is included, the metric is closer to net revenue retention, not GRR. |
Hypothetical Gross Revenue Retention Calculation
Suppose a SaaS company starts the year with $100 million of recurring revenue from an existing customer base. During the year, it loses $6 million from customers that churn and $4 million from customers that downgrade or contract. It also sells $12 million of expansion to remaining customers, but that expansion is not included in GRR.
Example: ($100 million – $6 million – $4 million) / $100 million × 100 = 90% gross revenue retention.
The company retained 90% of its starting recurring revenue before expansion. The $12 million of expansion may matter for net retention and growth analysis, but it does not change the gross revenue retention result.
How Investors Interpret Gross Revenue Retention
Investors often use GRR as a downside diagnostic for recurring revenue quality. A stable or improving GRR can suggest that customers continue to need the product and are not reducing spend materially. A weakening GRR can point to churn pressure, downgrade pressure, competitive displacement, customer budget stress, product-market fit issues, or pricing friction.
The useful reading usually comes from trend and context, not from one isolated number. One period can be affected by renewal timing, segment mix, contract resets, product migrations, or temporary budget pressure. A multi-period decline deserves closer attention because it may show that the revenue base is becoming less durable before the problem is fully visible in headline growth.
Peer comparison also needs caution. Enterprise SaaS, SMB SaaS, usage-based software, seat-based platforms, vertical software, infrastructure software, and product-led growth models can have different retention patterns. A lower GRR in one model is not automatically worse than a higher GRR in another model unless customer mix, contract length, pricing structure, and disclosure method are reasonably comparable.
Investor diagnostic checklist: before relying on a reported GRR number, check the revenue base, the measurement period, which churn and contraction items are included, whether expansion is fully excluded, and whether the company reports the metric consistently across periods or segments.
Investor interpretation boundary: GRR can support a retention-quality view, but it should be read alongside growth, net retention, gross margin, sales efficiency, customer concentration, free cash flow, and valuation.
Gross Revenue Retention vs Net Revenue Retention
Gross revenue retention and net revenue retention both analyze existing-customer revenue, but they answer different questions. GRR asks how much of the starting recurring revenue base survived churn and contraction before expansion. NRR asks how the existing-customer base changed after expansion revenue is added.
| Metric | Expansion Revenue | Typical Question | Interpretation Boundary |
|---|---|---|---|
| Gross revenue retention | Excluded | How much starting recurring revenue was retained before expansion? | Shows churn and contraction pressure, not total account growth. |
| Net revenue retention | Included | Did existing customers spend more or less after churn, contraction, and expansion? | Can offset churn with expansion, so it may hide weakness inside part of the customer base. |
The net revenue retention comparison is important because a company can report strong NRR while GRR is weakening if expansion from retained customers offsets losses elsewhere. That does not make NRR wrong; it means the two metrics should be read together.
When Gross Revenue Retention Can Mislead Investors
GRR can create false comfort when it is treated as a complete SaaS quality measure. A company may retain most of its existing recurring revenue but still have weak new customer growth, poor sales efficiency, margin pressure, high stock-based compensation, weak free cash flow conversion, or a valuation that already assumes strong future performance.
Segment mix can also distort the reading. A company with a large enterprise base may show a different retention profile from a company selling mostly to small businesses. A usage-based company may experience contraction differently from a seat-based subscription company. Without segment context, the same GRR number can describe different business realities.
Disclosure method matters as well. Some companies report dollar-based retention, gross dollar retention, gross revenue retention, cohort retention, logo retention, or net revenue retention with different definitions. Investors should read the company’s metric definition rather than assuming every retention label is calculated the same way.
Common mistake: treating high GRR as proof that the stock is attractive. GRR describes retention quality inside the recurring revenue base. It does not answer whether valuation, growth, margins, competitive position, or future expectations are favorable.
Common Mistake
A frequent mistake is to compare GRR across SaaS companies without checking the revenue base and definition. One company may report ARR-based gross retention, another may report MRR-based retention, and another may use a dollar-based cohort method. If the inputs are not comparable, the comparison can look precise while being analytically weak.
Another mistake is to focus on GRR while ignoring expansion. GRR is designed to exclude expansion, so it should not be used as the only customer-base metric. A company with lower GRR but strong, durable expansion may show a different customer economics profile from a company with high GRR and weak expansion. The point is not to prefer one metric automatically, but to understand what each metric is isolating.
Related SaaS Metrics
Gross revenue retention is one part of a broader SaaS metric set. ARR helps frame the annualized recurring revenue base, MRR helps frame monthly movement, and NRR helps show what happens to existing-customer revenue after expansion is included. Together, these metrics can help investors separate revenue durability, account expansion, and headline growth.
FAQ
What is gross revenue retention?
Gross revenue retention is the percentage of starting recurring revenue that a SaaS company keeps from existing customers after churn and downgrades, before counting expansion revenue.
Can gross revenue retention be above 100%?
No. Correctly calculated gross revenue retention cannot exceed 100% because expansion revenue is excluded. If expansion is included, the metric is no longer gross revenue retention.
Why does gross revenue retention exclude expansion revenue?
Gross revenue retention excludes expansion revenue to isolate downside pressure in the existing revenue base. It shows how much recurring revenue stayed intact before upsells, cross-sells, additional usage, or pricing expansion are counted.
Is gross revenue retention better than net revenue retention?
Neither metric is automatically better. Gross revenue retention is better for reading churn and contraction pressure, while net revenue retention is better for reading the total revenue change from existing customers after expansion is included.
Does high gross revenue retention prove a SaaS company is high quality?
No. High gross revenue retention can support a retention-quality view, but it does not prove growth quality, margin durability, acquisition efficiency, valuation support, or future investment returns by itself.