
CAC payback period measures how many months it takes a SaaS company to recover customer acquisition cost through gross-margin-adjusted recurring revenue. The result is most comparable when acquisition costs, customer revenue, gross margin, and the measurement period refer to the same customer cohort.
CAC Payback Period Formula
Customer-level formula: CAC payback period = CAC ÷ (monthly recurring revenue per customer × gross margin)
Using a monthly recurring-revenue denominator produces a result in months. If the revenue input starts with an annual amount, it needs to be converted to a comparable monthly gross-profit base before the result is interpreted as monthly payback.
Both approaches measure recovery time, but their numerators, revenue bases, and cohort timing need to be understood before the results are compared.
Divide CAC per customer by that customer or cohort’s monthly recurring revenue multiplied by gross margin.
Use fully loaded sales and marketing expense relative to recurring revenue acquired from the corresponding new-customer cohort, adjusted for gross margin and expressed in months.
Its CAC Payback Period standard uses fully loaded sales and marketing expense divided by new-customer contracted annual recurring revenue multiplied by subscription gross margin, then converts the result to months. The standard also aligns the acquisition-expense period with the later new-customer revenue period when the sales cycle creates a timing lag. Benchmarkit notes that public-company estimates may instead use net new ARR when new-customer CARR is not disclosed, so those estimates should not be treated as mechanically identical to new-logo cohort payback. Sources: SaaS Metrics Standards Board and Benchmarkit.
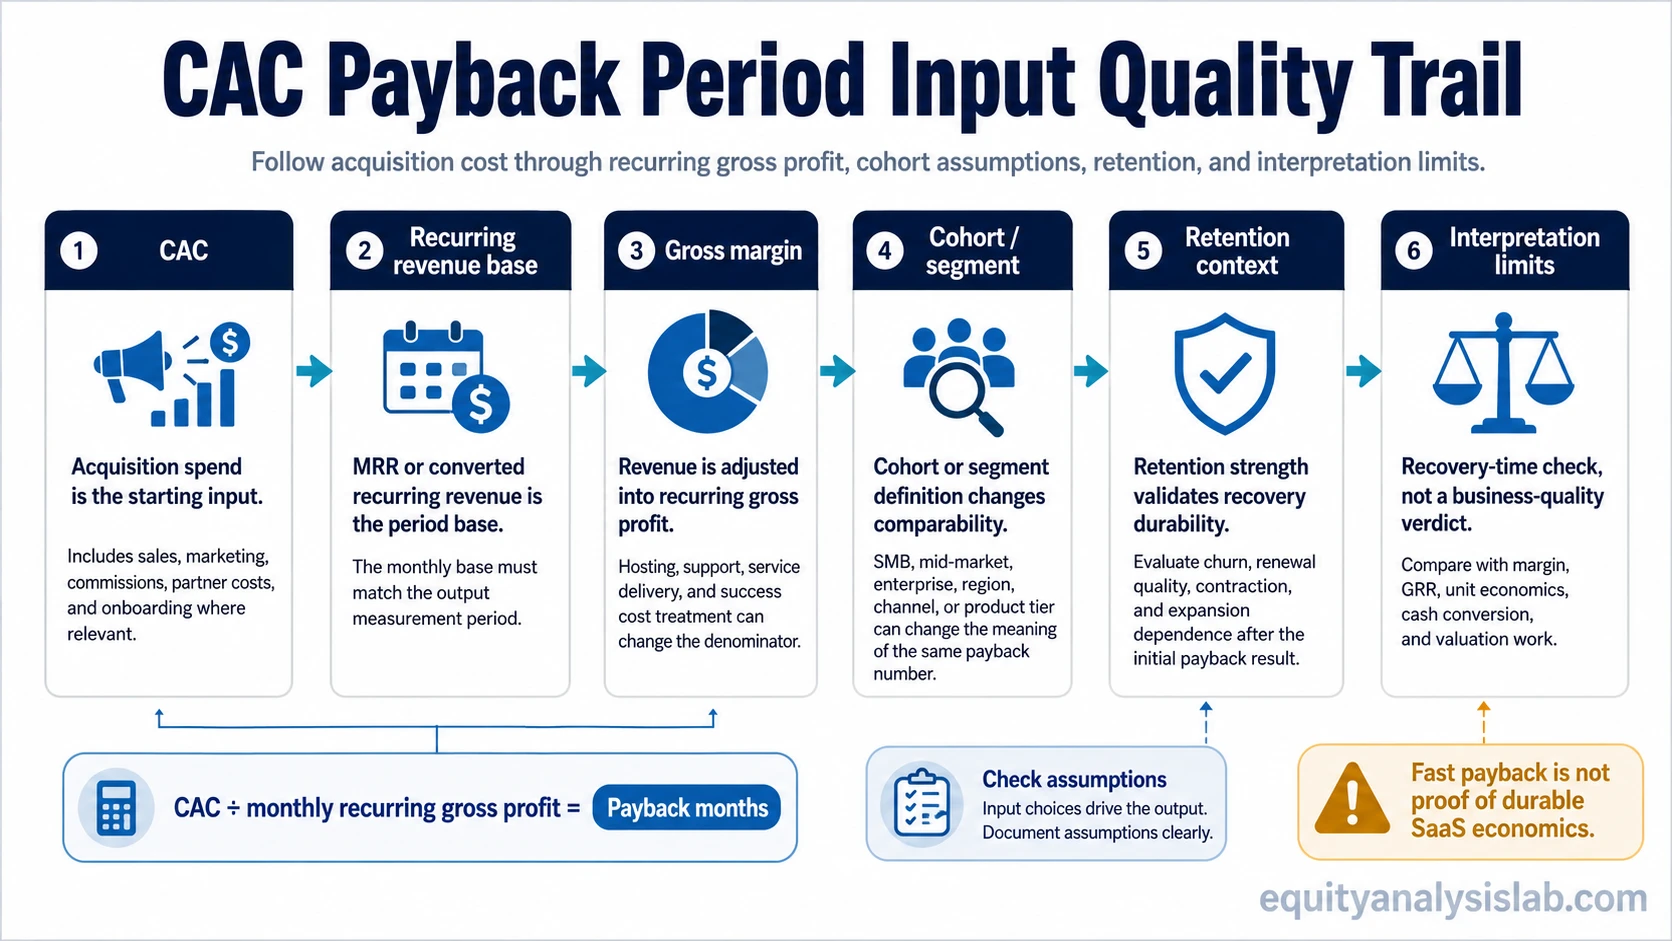
Inputs and Context That Change the Reading
| Input or context | What to verify | Why it matters |
|---|---|---|
| Acquisition cost basis | Whether sales and marketing costs are fully loaded and consistently allocated | A narrow CAC definition shortens the reported payback period. |
| Recurring revenue base | MRR per customer, new-customer ARR or CARR, or another disclosed cohort measure | Different revenue bases can produce results that are not directly comparable. |
| Gross margin | The margin convention applied to the recurring revenue being measured | Payback is based on the gross profit available after the cost of delivering the service, rather than headline revenue alone. |
| Customer cohort | SMB, mid-market, enterprise, product, region, or acquisition channel | Blended results can hide materially different acquisition economics across segments. |
| Sales-cycle timing | Whether acquisition expense is aligned with the period in which the corresponding new customers are booked | A long sales cycle can separate the expense period from the resulting recurring revenue period. |
| Retention and billing context | Churn, renewal behavior, contract terms, and cash collection timing | A customer can reach accounting payback while long-term retention or cash conversion still differs from the headline result. |
CAC Payback Period Example
Illustrative example: A SaaS company spends $1,200 to acquire one customer. The customer generates $200 of monthly recurring revenue, and the applicable gross margin is 75%.
Monthly recurring gross profit = $200 × 75% = $150.
CAC payback period = $1,200 ÷ $150 = 8 months.
The 8-month result describes recovery time under those inputs. A different CAC definition, margin convention, customer segment, or revenue base can change the result even when the underlying business appears similar at first glance.
CAC Payback Benchmarks Depend on ACV
In its 2025 SaaS Performance Metrics data, the CAC Payback Period chart uses a sample of 148 companies. Median payback varies from 8 months in the lowest ACV groups to 24 months in some higher-ACV groups. The figures describe that dataset and should be used as peer context rather than a universal target. Source: Benchmarkit 2025 SaaS Performance Metrics.
| Average contract value | Median CAC payback period |
|---|---|
| Below $1K | 8 months |
| $1K-$5K | 8 months |
| $5K-$10K | 14 months |
| $10K-$25K | 18 months |
| $25K-$50K | 22 months |
| $50K-$100K | 24 months |
| $100K-$250K | 24 months |
| Above $250K | 18 months |
The spread is more useful than a single headline threshold. A longer payback period can be normal for a higher-cost sales motion, while the same number can describe weak acquisition economics in a lower-touch business. Retention, margin, contract size, and sales-cycle structure determine whether the comparison is economically meaningful.
Where CAC Payback Period Can Mislead
The result can look favorable when acquisition costs are underloaded, gross margin is defined aggressively, customer segments are blended, or customers leave soon after the measured payback point. CAC payback also describes recovery through the selected gross-profit convention; billing terms and cash collection can create a different cash-flow profile.
For investor analysis, the headline number is strongest when the CAC definition, revenue cohort, gross-margin basis, sales-cycle timing, retention profile, and reporting method remain comparable across periods and peers.
Related SaaS Metrics
Use CAC to inspect the acquisition-cost input before interpreting the number of months required to recover it.
Use ARR to check the recurring-revenue base and period convention behind an annualized payback calculation.
Use GRR to test whether acquired recurring revenue remains durable before customer expansion is added.
Use LTV:CAC to compare expected customer value with acquisition cost over a longer horizon than the payback-period calculation.