Net dollar retention shows how much recurring revenue a SaaS company keeps from existing customers after expansion, contraction, and churn. It excludes revenue from new customers, so the metric focuses on the starting customer base rather than total company growth. For investors, NDR can support recurring-revenue quality analysis, but it cannot resolve valuation, margins, cash flow, customer concentration, stock safety, or future return by itself.
Definition: Net dollar retention measures the ending recurring revenue retained from an existing customer cohort as a percentage of that cohort’s starting recurring revenue. The calculation adds expansion revenue, subtracts contraction and churn, and excludes new customer revenue.
Key Points
- Net dollar retention uses revenue from existing customers, not total company revenue.
- Expansion from upgrades, add-ons, seats, usage, or pricing can lift NDR above 100%.
- Contraction, downgrades, and churn reduce the retained revenue base.
- New customer revenue is excluded from the NDR calculation.
- A strong NDR figure still needs disclosure quality, cohort context, valuation context, and customer concentration checks.
What Net Dollar Retention Means
Net dollar retention is a SaaS revenue-retention metric built around the same group of customers over a measurement period. If the starting customer base generates more recurring revenue by the end of the period than it did at the start, NDR can exceed 100%. If downgrades and churn outweigh expansion, NDR falls below 100%.
The metric is useful because SaaS revenue quality depends not only on adding new customers, but also on whether existing customers stay, expand, contract, or leave. A company with strong new bookings can still have weak revenue durability if existing customers are shrinking faster than new customers are added.
NDR is most useful when it is connected to the company’s recurring revenue base. In SaaS reporting, that base may be expressed through MRR, ARR, or another recurring revenue measure. The concept is closely related to annual recurring revenue because ARR provides the recurring revenue base that many SaaS retention metrics are trying to explain.
How Net Dollar Retention Is Calculated
The common formula logic is: starting recurring revenue from existing customers, plus expansion revenue, minus contraction revenue, minus churned revenue, divided by starting recurring revenue. The result is usually expressed as a percentage.
Formula logic: Net dollar retention = (starting recurring revenue + expansion revenue – contraction revenue – churned revenue) / starting recurring revenue.
| NDR input | How it affects the calculation | Investor interpretation |
|---|---|---|
| Starting recurring revenue | Forms the base of the existing customer cohort. | Shows what revenue level the company is trying to retain or expand. |
| Expansion revenue | Adds revenue from existing customers through upgrades, add-ons, higher usage, more seats, or price expansion. | Can suggest account growth, product adoption, higher usage, or pricing effects, but only if disclosure shows what is driving the expansion. |
| Contraction revenue | Subtracts downgrades, lower usage, reduced seats, or smaller contracts from existing customers. | May reveal budget pressure, product-fit issues, usage softness, or weaker account expansion. |
| Churned revenue | Subtracts revenue lost when existing customers leave. | Can show customer loss, competitive pressure, implementation problems, or weak retention quality. |
| New customer revenue | Excluded from the NDR calculation. | Prevents new sales from hiding what happened inside the starting customer base. |
What NDR Can Tell Investors
NDR separates surface-level revenue growth from the behavior of the existing customer base. A company may grow total revenue because it adds new customers, but NDR asks a narrower question: did the starting customer base spend more, less, or about the same after expansion, contraction, and churn?
A figure above 100% means expansion from retained customers exceeded contraction and churn during the measured period. That is a more useful revenue-quality signal when it is supported by stable cohort behavior, broad-based expansion, consistent disclosure, and reasonable customer concentration.
A figure below 100% means the starting customer base ended the period with less recurring revenue than it began with. The cause may be churn, downgrades, lower usage, discounting pressure, or weaker account expansion. Interpretation depends on customer mix, reporting period, product maturity, and disclosure consistency.
Observability note: NDR is only as useful as the disclosure behind it. A cleaner reading comes from a clear metric definition, consistent reporting, visible expansion and retention context where available, and enough detail around customer cohorts, ARR or MRR base, churn, and contraction.
NDR vs NRR vs Gross Revenue Retention
NDR and NRR often refer to similar or overlapping SaaS retention concepts, but company disclosures may use different labels. The safest reading is to inspect the company’s own definition and confirm which revenue movements are included.
NDR and NRR: The net revenue retention metric often captures the same core idea: retained revenue from existing customers after expansion, contraction, and churn. Label differences matter less than the stated formula and disclosure scope.
Gross revenue retention is different because it normally excludes expansion. Gross revenue retention focuses on how much revenue remains before upsells or expansion are added back. That makes GRR useful for seeing the downside pressure from churn and contraction without letting expansion offset the loss.
| Metric | Expansion included? | Main question answered |
|---|---|---|
| Net dollar retention | Yes | Did the existing customer base expand or shrink after expansion, contraction, and churn? |
| Net revenue retention | Usually yes, depending on company definition | How much revenue was retained from existing customers after netting expansion and losses? |
| Gross revenue retention | No | How much revenue remained before expansion offset churn or contraction? |
Limits of Net Dollar Retention
Limitation: High NDR is not the same as a complete investment thesis. It can support analysis of SaaS revenue quality, but it does not prove business quality, valuation attractiveness, stock safety, or future return.
A high NDR figure can hide weaker details if expansion comes from a small number of large customers while smaller customers churn or downgrade. It can also look strong during a period of pricing actions even if future expansion becomes harder. Without segment, cohort, and concentration context, the headline percentage can look more stable than the underlying customer base.
A low or falling NDR figure also needs context. It may reflect churn pressure, weaker usage, product maturity, budget cuts, or temporary contraction after unusually strong prior expansion. The metric becomes more useful when compared with ARR growth, customer count trends, gross retention, revenue growth, gross margin, sales efficiency, and management’s disclosure consistency.
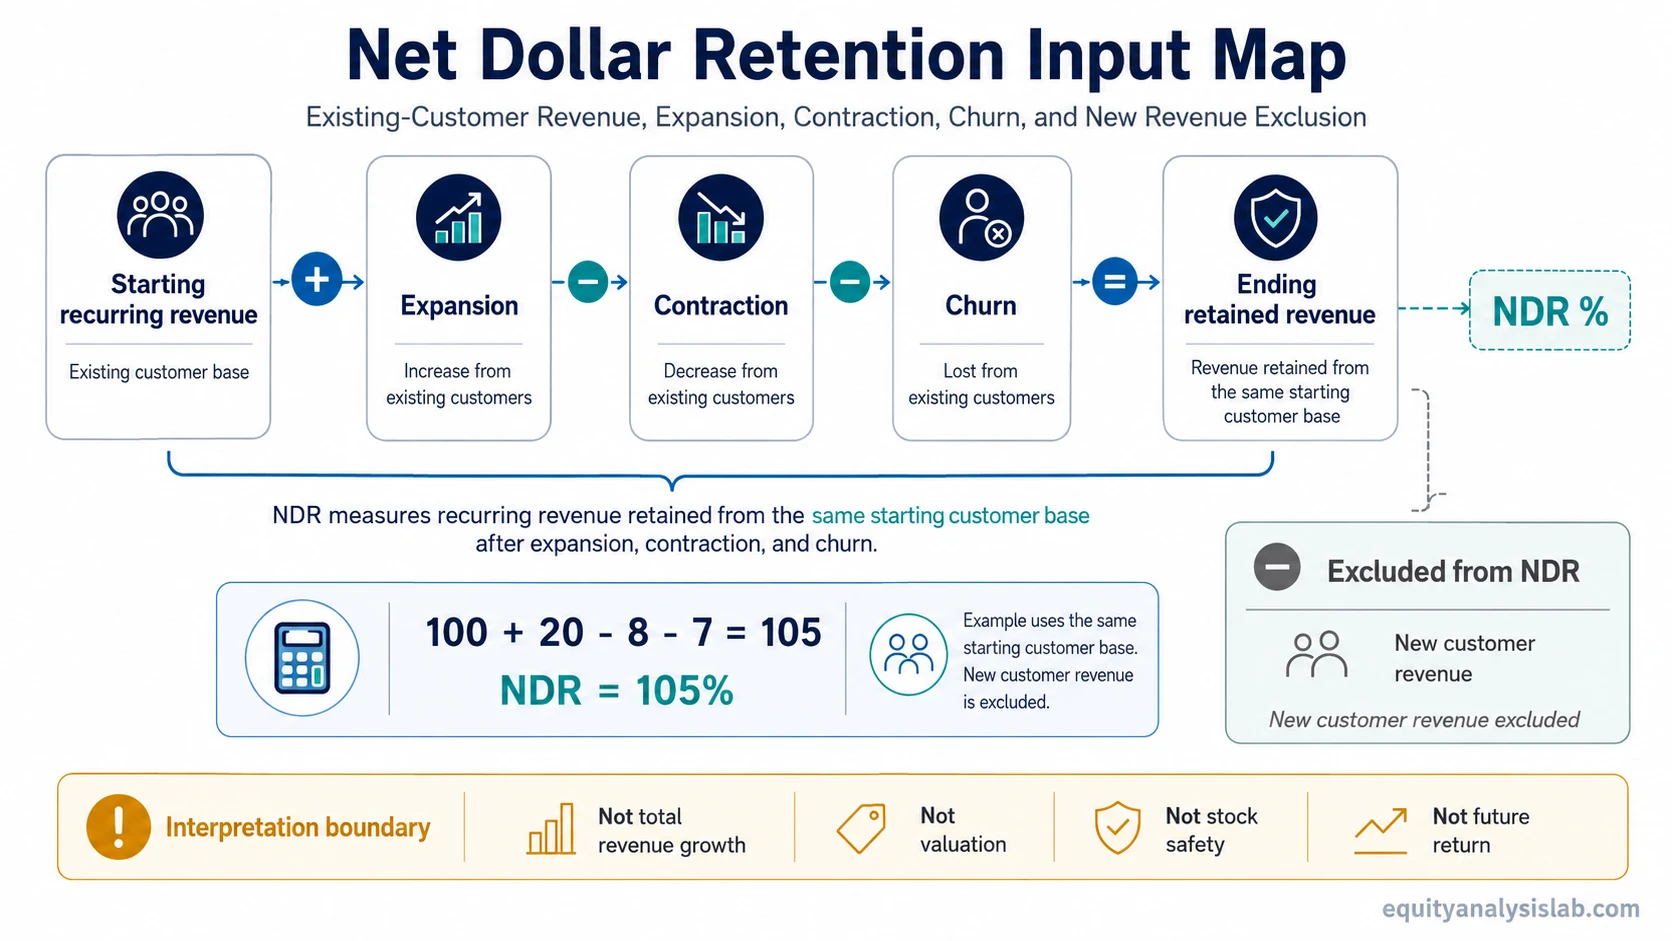
Simple Net Dollar Retention Example
A SaaS company begins a period with 100 in recurring revenue from existing customers. During the period, existing customers add 20 through expansion, reduce 8 through downgrades or lower usage, and remove 7 through churn. Ending retained revenue from the same starting customer base is 105, so NDR is 105%.
The 105% result does not include revenue from new customers added during the period. It only describes what happened to the recurring revenue attached to the starting customer base.
Common Mistakes When Reading NDR
| Mistake | Why it matters | Cleaner interpretation |
|---|---|---|
| Treating NDR as total revenue growth | NDR excludes new customer revenue. | Use it to analyze existing-customer revenue behavior, not total company growth by itself. |
| Assuming NDR above 100% proves pricing power | Expansion can come from usage, seats, upgrades, mix, or price changes. | Check what type of expansion is driving the figure. |
| Ignoring concentration | A few large accounts can lift NDR while smaller cohorts weaken. | Look for cohort detail, customer concentration, and segment disclosure where available. |
| Comparing companies without definitions | Disclosure methods and labels may differ. | Read each company’s metric definition before comparing NDR, NRR, or GRR. |
| Turning NDR into a stock conclusion | A retention metric does not resolve valuation, margins, cash flow, dilution, or risk. | Use NDR as one input in broader company analysis. |
FAQ
What is net dollar retention?
Net dollar retention measures how much recurring revenue a SaaS company keeps from existing customers after expansion, contraction, and churn. It excludes new customer revenue.
Can net dollar retention be above 100%?
Yes. NDR can be above 100% when expansion revenue from existing customers is larger than the revenue lost through contraction and churn.
Is net dollar retention the same as net revenue retention?
The terms often overlap, but company disclosures can vary. The important step is to check the company’s own definition and confirm whether expansion, contraction, and churn are included.
Does high net dollar retention mean a SaaS stock is attractive?
No. High NDR can support revenue-quality analysis, but it does not prove valuation, stock safety, business quality, or future return by itself.