A stock screener is a tool that filters a large universe of stocks using selected criteria such as valuation ratios, profitability metrics, market capitalization, sector, dividend yield, or balance-sheet measures.
For an investor, the useful role of a stock screener is candidate discovery. It can reduce thousands of listed companies into a smaller research list, but a matched result is not evidence by itself that a stock is high quality, undervalued, safe, or likely to deliver a strong return.
Definition: A stock screener applies user-selected filters to a stock universe and returns the companies that match those inputs. The output is a starting list for research, not an investment thesis.
Key Points About Stock Screeners
- A stock screener filters stocks by selected inputs such as valuation, profitability, size, sector, dividend yield, or financial strength.
- The result is a research candidate list, not proof that the companies are good investments.
- The quality of the output depends on the quality of the criteria, the data, and the investor’s interpretation.
- Fundamental investors still need to review the business, valuation, earnings quality, balance sheet, and cash-flow evidence after screening.
How a Stock Screener Works
A stock screener usually starts with a broad universe, such as all listed U.S. stocks, all companies in a region, or all stocks available in a provider’s database. The investor then adds filters that describe the type of company or valuation profile they want to examine.
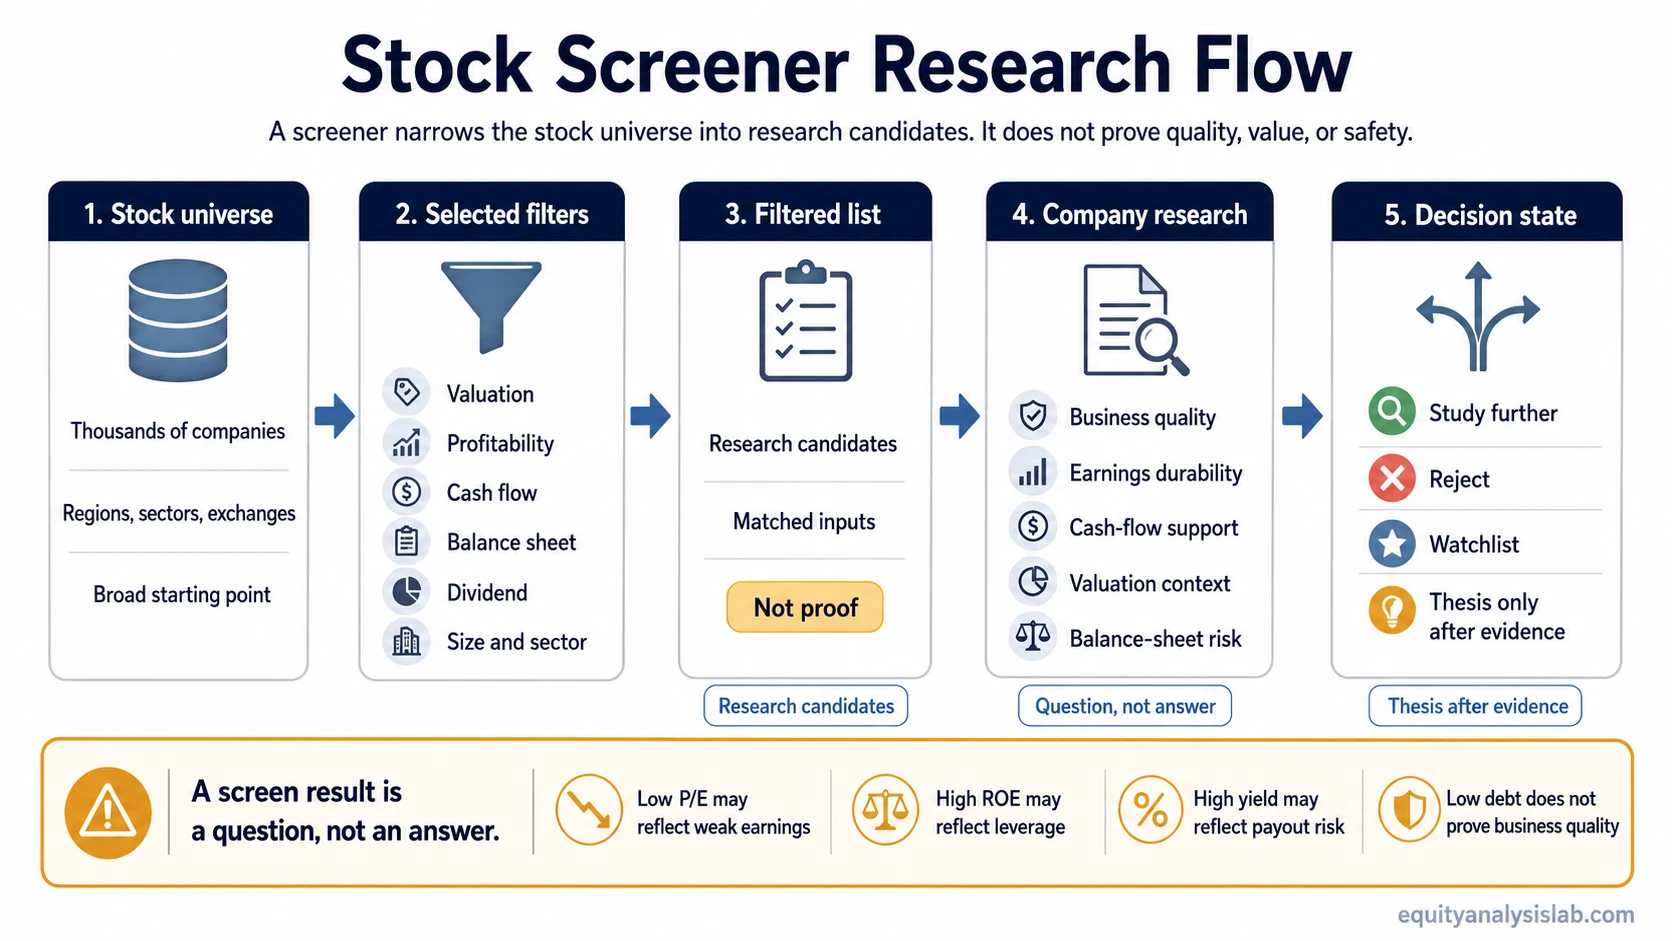
The basic sequence is simple: choose a universe, select criteria, apply filters, review the filtered list, then investigate the remaining companies one by one. The screening step narrows the field. The research step decides whether any company deserves more attention.
Screening sequence: stock universe → selected criteria → filtered list → company-level research → thesis decision or rejection.
Common Stock Screener Criteria
Stock screener criteria vary by provider, but most fundamental screeners let investors filter by broad categories such as valuation, profitability, growth, financial strength, dividends, size, and industry classification.
| Criteria group | Examples | Investor use |
|---|---|---|
| Valuation | price-to-earnings ratio, price-to-sales, enterprise value multiples | Find stocks that appear cheaper or more expensive by selected valuation measures. |
| Profitability | return on equity, operating margin, net margin | Identify companies with stronger reported profitability characteristics. |
| Cash-flow | free cash flow yield, operating cash flow, free cash flow margin | Look for companies where accounting earnings may be supported by cash generation. |
| Balance sheet | debt-to-equity, interest coverage, current ratio | Filter for financial strength, leverage risk, or liquidity characteristics. |
| Dividend | dividend yield, payout ratio, dividend growth | Find companies with income characteristics that may deserve deeper dividend safety review. |
| Business category | sector, industry, country, exchange, market capitalization | Narrow the universe by company type, size, or operating environment. |
| Technical or market data | price trend, volume, relative strength, moving average filters | Often secondary for fundamental investors, useful as context rather than a thesis substitute. |
What Screener Results Can and Cannot Prove
The most important limitation is that a screener only reflects the filters applied. A company can pass a screen because it matches a number, while the underlying business, accounting quality, leverage profile, or valuation context still fails deeper review.
| Screener output | What it can show | What it cannot prove | Next research step |
|---|---|---|---|
| Low P/E ratio | The stock has a low price relative to reported earnings under the selected data source. | It cannot confirm undervaluation because earnings may be cyclical, declining, distorted, or facing multiple compression. | Review earnings quality, forward earnings risk, industry context, and valuation history. |
| High ROE | The company reports strong net income relative to shareholders’ equity. | It cannot confirm durable business quality because ROE can be affected by leverage, buybacks, low equity base, or one-time earnings. | Compare ROE with return on invested capital, leverage, margins, and cash conversion. |
| High free cash flow yield | The company may be producing meaningful free cash flow relative to market value. | It does not prove the cash flow is durable, recurring, or available to shareholders. | Check capital intensity, working capital swings, reinvestment needs, and balance-sheet obligations. |
| High dividend yield | The stock offers a high dividend yield based on the current share price and payout data. | It does not prove dividend safety, because yield can rise when the share price falls. | Review payout ratio, free cash flow coverage, debt maturity, and earnings stability. |
| Low debt | The company has limited financial leverage under the selected balance-sheet metric. | It does not prove the business is attractive, growing, profitable, or well valued. | Study business quality, reinvestment prospects, margins, returns on capital, and valuation. |
How Investors Should Interpret Screener Results
A good screener result is a question, not an answer. It tells the investor which companies match the selected filters, then the investor must decide whether those filters actually capture the kind of business, valuation, or risk profile they intended to study.
For example, an investor may screen for companies with low P/E ratios and high reported profitability. The filtered list may look attractive at first, but the next step is to test whether earnings are durable, whether profitability is supported by real business economics, whether cash flow confirms the accounting numbers, and whether the valuation is cheap for a reason.
Example: A company that passes a low P/E and high ROE screen may still deserve rejection if earnings are temporarily elevated, leverage is driving the ROE, free cash flow is weak, or the business faces a structural decline.
Stock Screener vs Stock Selection Criteria
A stock screener is the tool used to apply filters. Stock selection criteria are the standards an investor chooses before using the tool. The difference matters because a screener cannot decide whether the criteria are sensible.
If the criteria are too broad, the output may be noisy. If the criteria are too narrow, the investor may exclude companies that deserve review. If the criteria focus only on one metric, the result may miss business quality, cash-flow durability, balance-sheet risk, or valuation context.
Useful distinction: the screener performs the filtering. The investor is responsible for choosing the right filters, questioning the output, and rejecting companies that pass the screen for weak reasons.
Limitations of Stock Screeners
Stock screeners are useful because they save time, but they are limited by data quality, metric definitions, reporting lag, accounting differences, and the investor’s filter design. A screen can miss companies that do not fit the selected criteria and include companies whose numbers look attractive for temporary or misleading reasons.
Screeners are also weaker when they are used without business context. A valuation filter may ignore cyclicality. A profitability filter may ignore leverage. A dividend filter may ignore payout risk. A growth filter may ignore dilution or poor cash conversion.
Common Mistakes When Using a Stock Screener
- Treating the output as a buy list: a screener result is only a candidate list for deeper research.
- Assuming low P/E means cheap: low multiples can reflect weak earnings quality, cyclicality, balance-sheet risk, or falling expectations.
- Assuming high ROE means quality: ROE needs leverage, ROIC, margins, and cash-flow context before it can support a quality argument.
- Assuming high dividend yield means safety: dividend yield can rise because the share price fell, not because the payout became safer.
- Assuming low debt means a strong business: a low-debt company can still have weak margins, poor reinvestment prospects, or unattractive valuation.
- Confusing fundamental screeners with trading scanners: fundamental screeners support research discovery; trading scanners often focus on short-term price, volume, and momentum behavior.
Related Concepts for Deeper Research
After a stock screener creates a candidate list, the next step is to examine the evidence behind the filters. Profitability screens often require deeper work on return on equity and return on invested capital. Valuation screens often require context around the price-to-earnings ratio and free cash flow yield.
| Research question | Related concept | Why it matters after screening |
|---|---|---|
| Is reported profitability meaningful? | Return on equity | ROE can help interpret profitability, but it needs leverage and equity-base context. |
| Is the company earning strong returns on the capital used in the business? | Return on invested capital | ROIC can help test whether profitability reflects business economics rather than only financial structure. |
| Is the stock statistically cheap or only optically cheap? | Price-to-earnings ratio | P/E needs earnings durability, cyclicality, and forward risk context. |
| Is cash generation supporting the valuation case? | Free cash flow yield | Free cash flow yield can help separate accounting earnings from cash-generating capacity. |
FAQ
Is a stock screener the same as stock analysis?
No. A stock screener filters a stock universe by selected criteria. Stock analysis examines the business, valuation, earnings quality, balance sheet, cash flow, competitive position, and risks behind each candidate.
Can a stock screener tell whether a stock is good?
No. A stock screener can show that a stock matched certain inputs, but it cannot prove that the company is high quality, undervalued, financially safe, or suitable for an investor’s process.
What makes a stock screener result misleading?
A result can be misleading when the inputs are too simplistic, the data is stale, the metric is distorted, or the filter ignores business context. Low P/E, high ROE, high dividend yield, and low debt all need deeper interpretation before they support a thesis.