Comparable company analysis estimates value by applying valuation multiples from similar companies to a target company’s financial metric. Peer choice, metric quality, adjustments, and market pricing can all change the implied valuation range, so the result is not proof of fair value.
Comparable company analysis: a valuation method that compares a target company with similar public companies and applies selected peer multiples to the target company’s revenue, EBITDA, earnings, free cash flow, or another financial metric.
The method is often called comps analysis or CCA. It uses observable market prices, but the final range still relies on judgments about which companies are comparable and which metrics deserve the most weight.
What comparable company analysis means
Comparable company analysis is a narrower form of relative valuation. Relative valuation compares an asset with other priced assets. Comparable company analysis applies that idea specifically to companies that appear similar by business model, sector, growth profile, profitability, capital intensity, risk, or financial structure.
The method does not start by forecasting every future cash flow. It starts with how the market currently values a peer group, then applies a selected multiple range to the target company’s financial metric. That makes CCA useful for market context, but it also means the output can inherit the market’s mistakes, cycle conditions, and peer-group distortions.
How comparable company analysis works
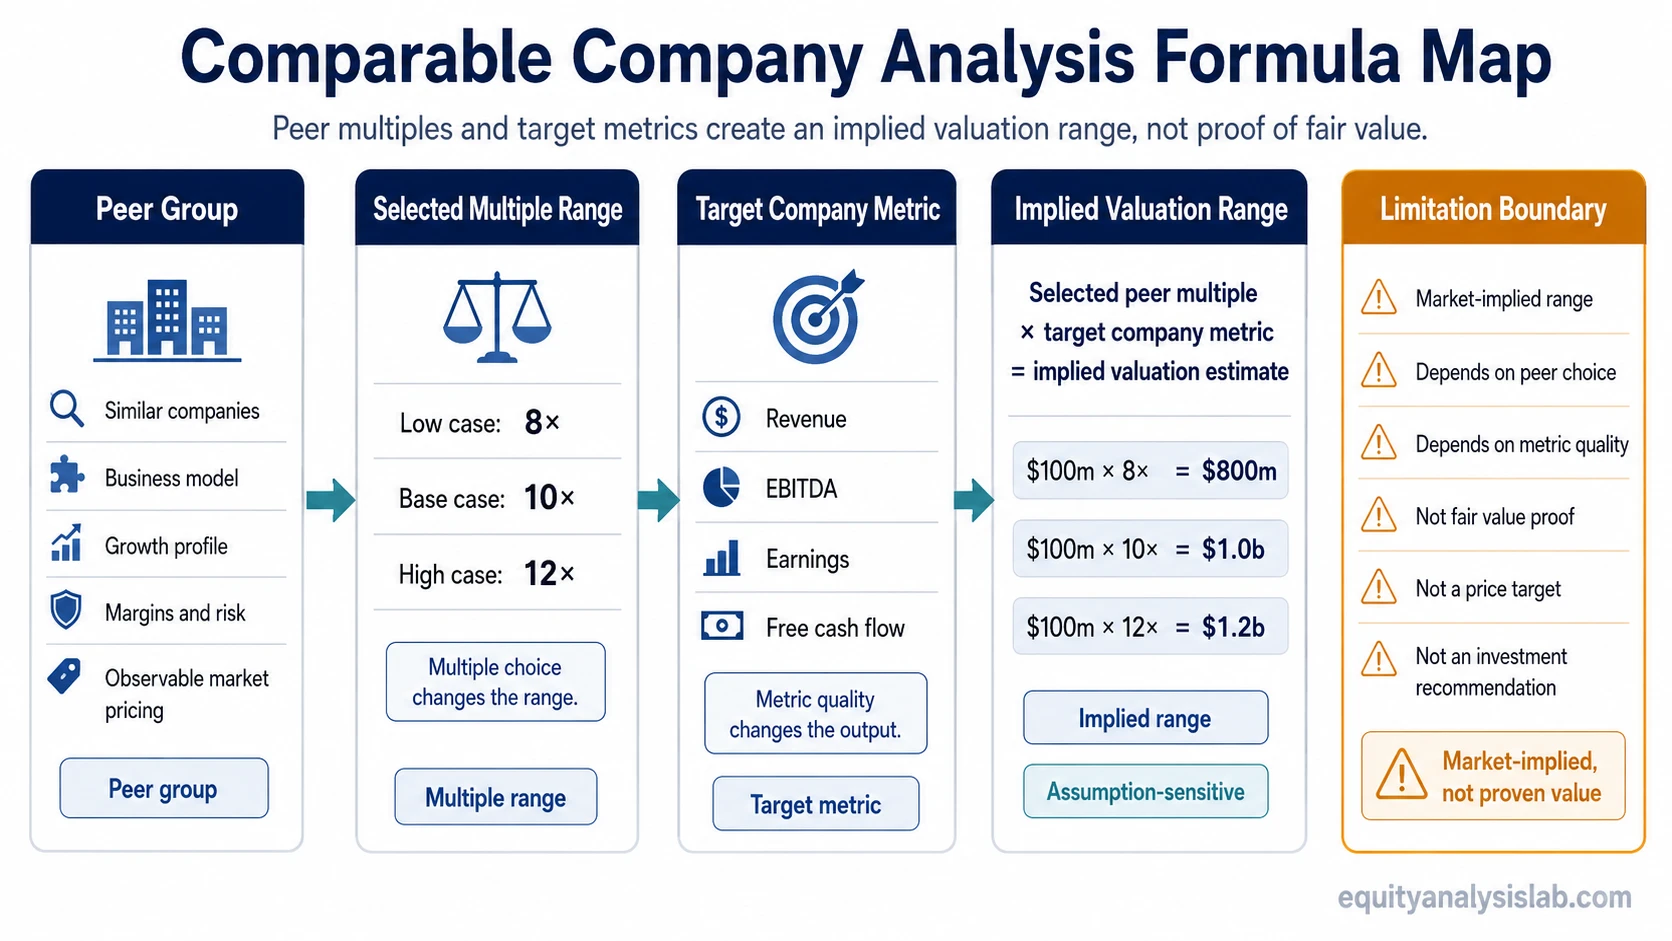
The basic mechanism is simple: a peer multiple is applied to a target company metric to produce an implied valuation estimate.
Simple mechanism: selected peer multiple × target company metric = implied valuation estimate.
A valuation multiple connects a market value measure with a financial measure. Enterprise-value multiples compare enterprise value with metrics such as revenue or EBITDA. Equity-value multiples compare common equity value with metrics such as earnings per share or net income. The numerator and denominator must match the purpose of the analysis.
| Step | What the analyst chooses | Why it matters |
|---|---|---|
| Define the peer group | Companies with similar business, growth, margins, risk, and capital structure | The peer set creates the benchmark range used in the analysis. |
| Choose valuation multiples | Examples include EV/EBITDA, EV/Revenue, P/E, or price to free cash flow | Different multiples can produce different implied values for the same company. |
| Select the target metric | Revenue, EBITDA, EPS, free cash flow, or another relevant financial measure | The output changes when the metric is normalized, forward-looking, or distorted. |
| Apply a range | Low, base, and high peer multiple cases | A range is usually more honest than a single-point estimate. |
| Interpret the result | Implied enterprise value or equity value | The result is a market-implied benchmark, not an investment conclusion. |
Inputs used in comparable company analysis
A comparable company analysis is only as useful as its inputs. The peer companies, selected metrics, accounting adjustments, and market-pricing date all shape the implied valuation range before any business judgment is made.
| Input | Role in the analysis | Common interpretation risk |
|---|---|---|
| Peer group | Sets the market benchmark used for comparison | Similar sector labels can hide very different growth, margin, or risk profiles. |
| Market prices | Convert peer-company trading levels into valuation multiples | A temporary market dislocation can make the peer range too high or too low. |
| Enterprise value or equity value | Determines whether the analysis values the whole business or common equity | Mixing enterprise-value and equity-value logic can distort the result. |
| Financial metric | Provides the denominator for the selected multiple | Revenue, EBITDA, EPS, and free cash flow can tell different stories. |
| Adjustments | Normalize non-recurring items, accounting differences, cash, debt, or unusual costs | Unadjusted figures can make weak peers look cleaner than they are. |
| Multiple range | Turns peer evidence into low, base, and high valuation cases | A narrow range can create false precision when the underlying inputs are uncertain. |
Why assumptions change the output
Comparable company analysis can look objective because it uses market prices and reported financial metrics. The fragile part is the judgment layer. Two analysts can review the same company and still reach different ranges if they choose different peers, normalize earnings differently, or give more weight to different multiples.
| Input or judgment | How it affects output | Failure mode |
|---|---|---|
| Peer group | Sets the benchmark multiple range | Wrong peers create false precision. |
| Metric denominator | Revenue, EBITDA, EPS, or free cash flow changes the implied value | Mismatched numerator and denominator logic distorts comparison. |
| Growth and margin profile | Explains why one company may deserve a higher or lower multiple | A high multiple may reflect growth, margins, cyclicality, or accounting noise. |
| Balance sheet context | Net debt and cash change the bridge from enterprise value to equity value | Ignoring leverage can misstate common-equity value. |
| Market pricing date | Uses observable market prices at a point in time | Temporary dislocation can distort the peer range. |
| Accounting adjustments | Normalizes non-recurring items and comparability issues | Unadjusted numbers can make peers look more comparable than they are. |
The useful question is not only “what multiple did the peer group trade at?” A stronger analysis asks whether that peer group is economically relevant, whether the metric is durable, and whether the implied range still makes sense beside business quality, cash-flow durability, and balance-sheet risk.
Comparable company analysis example
Illustrative scenario: assume a target company has $100 million of EBITDA. If the selected peer range is 8x to 12x EBITDA, the implied enterprise value range changes materially before any investment conclusion is made.
| Case | Target EBITDA | Selected EV/EBITDA multiple | Implied enterprise value |
|---|---|---|---|
| Low case | $100 million | 8x | $800 million |
| Base case | $100 million | 10x | $1.0 billion |
| High case | $100 million | 12x | $1.2 billion |
This example is deliberately simple. It shows how a change in the selected multiple can move the implied enterprise value by hundreds of millions of dollars even when the target company’s EBITDA assumption does not change. In a real analysis, the bridge from enterprise value to equity value would also need cash, debt, minority interests, preferred equity, and share-count considerations where relevant.
What comparable company analysis can and cannot tell you
Comparable company analysis can help frame how the market values similar companies. It can show whether a target company appears high, low, or in line relative to a selected peer group, but that comparison is only as strong as the peer set and metrics behind it.
CCA can help with: market-implied valuation context, peer multiple ranges, sector-level valuation comparison, and sensitivity to metric selection.
CCA cannot prove: intrinsic value, expected return, fair value, investment merit, or a target price.
A discounted cash flow analysis approaches valuation from projected cash flows and a discount-rate framework. Comparable company analysis approaches valuation from market multiples. The two methods can be used beside each other, but one does not automatically validate the other.
Limitations of comparable company analysis
False precision: a clean spreadsheet output can hide weak peer selection or unstable inputs.
Peer mismatch: companies in the same sector may differ by growth, margins, geography, customer concentration, regulation, cyclicality, or capital intensity.
Market-cycle distortion: peer multiples reflect current market pricing, which can be optimistic, pessimistic, or temporarily dislocated.
Metric mismatch: EV/EBITDA, EV/Revenue, P/E, and free-cash-flow multiples do not answer the same valuation question.
Accounting differences: non-recurring charges, capitalization policies, lease treatment, stock-based compensation, and acquisition effects can reduce comparability.
Leverage and cash bridge risk: enterprise-value estimates still need a careful bridge to equity value when debt, cash, preferred equity, minority interests, or diluted share count matter.
The practical mistake is treating the selected peer multiple as objective truth. A peer range is a market-implied benchmark, not a complete valuation conclusion. It should be interpreted with the company’s business model, earnings quality, cash conversion, balance-sheet risk, and valuation assumptions.
Comparable company analysis vs other valuation methods
Comparable company analysis is most useful when the reader needs market context for similar companies. It is less useful when the company has no clean peers, when near-term metrics are distorted, or when the central question depends on long-term cash-flow assumptions.
| Method | Main valuation logic | Best use |
|---|---|---|
| Comparable company analysis | Applies peer-company multiples to a target company metric | Market-implied valuation context |
| Relative valuation | Compares valuation across priced assets or companies | Broader comparison framework |
| Discounted cash flow | Values expected future cash flows using a discount-rate framework | Forecast-driven valuation work |
| DCF formula | Shows the mechanics of discounting projected cash flows | Understanding the formula behind DCF estimates |
| Dividend discount model | Values a stock from expected dividends and required return assumptions | Dividend-centered valuation cases |
For formula mechanics, the DCF formula is a separate route. For dividend-centered valuation, the dividend discount model uses a different input structure. Comparable company analysis should stay focused on peer multiples and the assumptions that make those multiples meaningful or fragile.
How to read a comparable company analysis result
A CCA result is strongest when it is read as a range with conditions attached. The range becomes more useful when the peers are economically similar, the selected metric reflects durable performance, the balance-sheet bridge is handled carefully, and the market-pricing date is clear.
Useful interpretation: “Based on this peer group, this metric, and these adjustments, the market-implied valuation range is X to Y.”
Unsafe interpretation: “The comps output proves the company is worth X.”
Peer selection can become detailed quickly because analysts must compare business model, growth, margins, leverage, accounting quality, and market context. For that narrower question, see how to choose comparable companies.
FAQ
Is comparable company analysis the same as relative valuation?
No. Comparable company analysis is one form of relative valuation. Relative valuation is the broader family, while CCA focuses on valuing a target company using peer-company multiples.
Does comparable company analysis show fair value?
It can provide a market-implied valuation range, but it does not prove fair value. Peer selection, metric quality, market pricing, leverage, and accounting adjustments all shape the range.
Why can two comparable company analyses produce different results?
Different analysts may choose different peers, normalize financial metrics differently, use different multiples, or apply different adjustments. Those choices can change the implied valuation range.