Price to free cash flow is a valuation multiple that compares a company’s equity value with the free cash flow available after operating needs and capital expenditures. It is often written as P/FCF.
The ratio is useful because free cash flow can be closer to owner-relevant cash generation than accounting earnings, but the result depends heavily on the free-cash-flow denominator. A low P/FCF ratio does not automatically prove undervaluation, and a high P/FCF ratio does not automatically prove overvaluation.
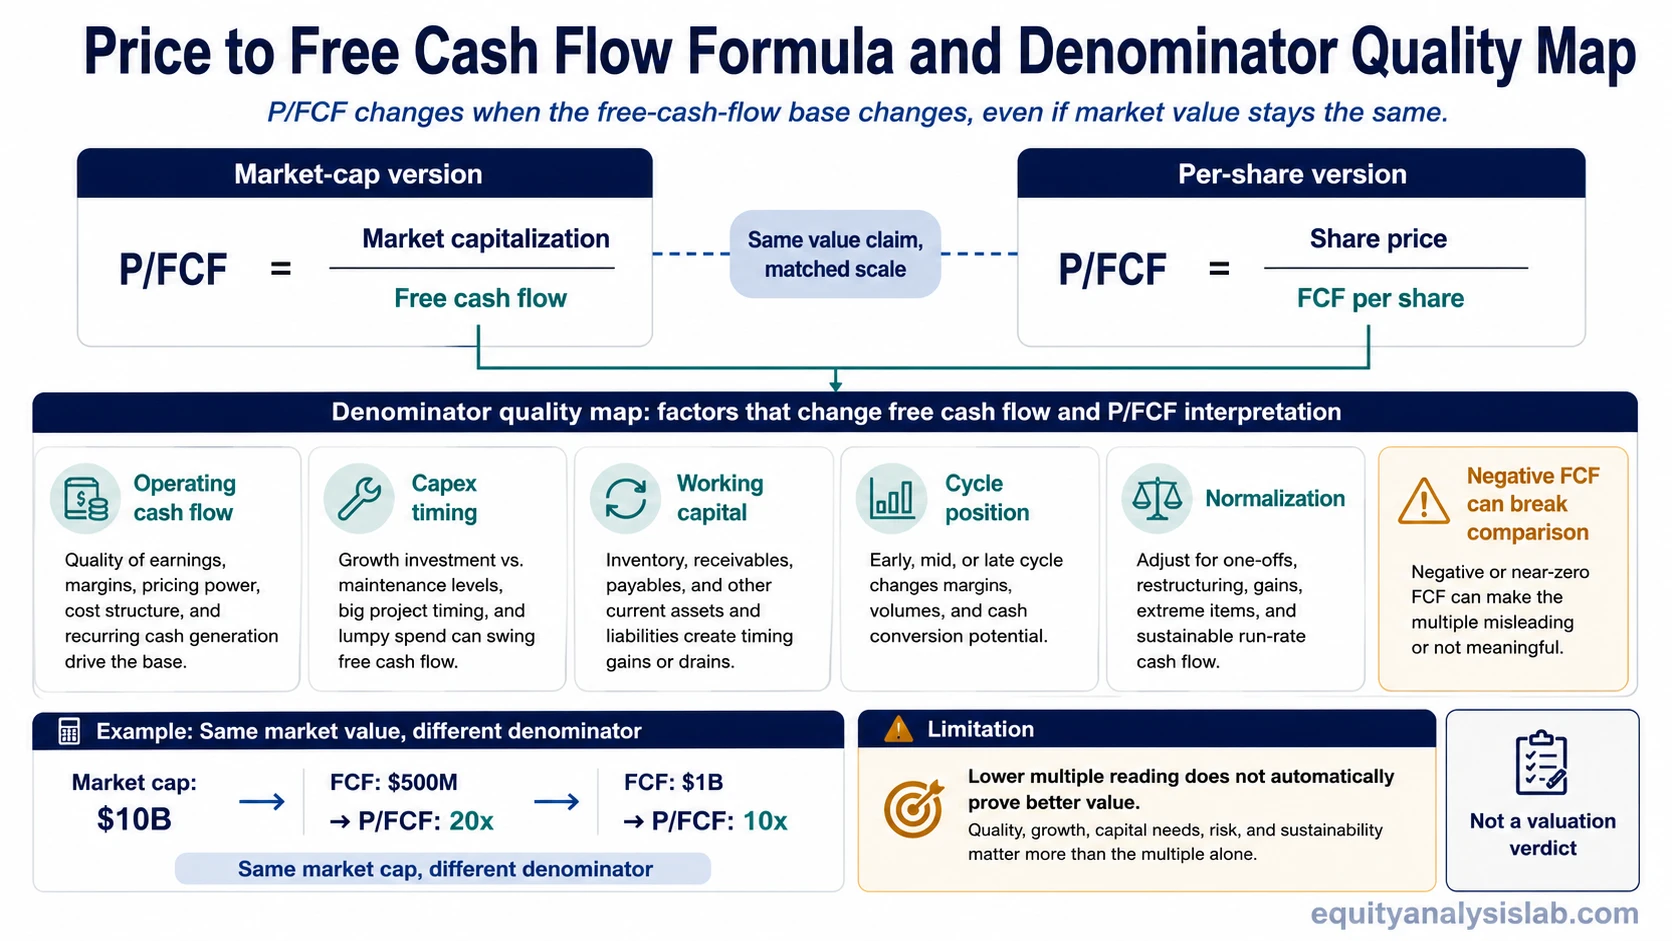
Definition: Price to free cash flow measures how much the market is paying for each dollar of free cash flow. It can be calculated using market capitalization divided by free cash flow, or share price divided by free cash flow per share.
Key Points
- P/FCF compares equity value with free cash flow, not net income.
- The denominator can change sharply when capex, working capital, or cash conversion changes.
- Negative or temporarily distorted free cash flow can make the ratio hard to compare.
- P/FCF is most useful when the free cash flow base is normalized and comparable.
Price to free cash flow formula
The market-cap version compares the total equity value of the company with total free cash flow:
Price to free cash flow = Market capitalization / Free cash flow
The per-share version compares the share price with free cash flow per share:
Price to free cash flow = Share price / Free cash flow per share
The numerator and denominator must describe the same value claim. Market capitalization should be compared with total free cash flow, while share price should be compared with free cash flow per share.
Free cash flow is commonly treated as operating cash flow minus capital expenditures. The cash-flow base is explained more directly in free cash flow, while P/FCF focuses on how that denominator changes valuation interpretation.
What price to free cash flow tells investors
P/FCF shows how much investors are paying for a company’s free cash flow. If two companies have similar business quality, capital intensity, growth prospects, and accounting reliability, the one with the lower P/FCF may appear less expensive on a cash-flow basis.
That comparison can break down when the companies differ in reinvestment needs, working-capital timing, cyclicality, debt structure, or free-cash-flow durability. The ratio is a comparison tool, not a final valuation answer.
Why the free-cash-flow denominator matters
The same market capitalization can produce very different P/FCF readings depending on the free-cash-flow number used. A company can look cheaper because cash generation improved, but it can also look cheaper because capex was delayed, working capital temporarily helped cash flow, or a cyclical peak lifted operating cash flow.
The numerator shows what the market is paying. The denominator determines whether that price is being compared with durable cash generation or with a temporary cash-flow snapshot.
| Denominator layer | Question to ask | Why it changes interpretation |
|---|---|---|
| Operating cash flow | Is cash generation recurring or temporarily boosted? | A one-period cash-flow improvement may not represent durable business quality. |
| Capital expenditures | Is capex normal, elevated, or temporarily reduced? | Lower capex can increase free cash flow even if the company is deferring investment. |
| Working capital | Did receivables, inventory, or payables create a temporary cash benefit? | Working-capital timing can lift or depress free cash flow without changing long-term value. |
| Cyclicality | Is free cash flow near a cycle peak or trough? | A cyclical high can make the ratio look cheap, while a trough can make it look expensive. |
| Normalization | Would a multi-year or adjusted free-cash-flow base tell a different story? | Normalized FCF can reduce the risk of valuing a company on an unusual period. |
Price to free cash flow sensitivity table
P/FCF is sensitive because both sides of the ratio can move. The market capitalization can change, and the free-cash-flow denominator can change for reasons that are not always equal in quality.
| Input change | What happens to P/FCF | Interpretation risk |
|---|---|---|
| Free cash flow rises because operating cash flow improves | P/FCF may fall | Could reflect better cash generation, but durability still matters |
| Free cash flow rises because capex is temporarily reduced | P/FCF may fall | The ratio may look cheaper even if investment is being deferred |
| Working capital temporarily boosts cash flow | P/FCF may fall | The denominator may not repeat |
| Free cash flow falls because capex rises | P/FCF may rise | Could reflect pressure, or reinvestment for future growth |
| Free cash flow is negative | Ratio may become unusable | Comparison can break down |
| Market cap rises faster than FCF | P/FCF rises | Expectations may be high, and quality or growth must justify it |
Simple P/FCF example
Assume a company has a market capitalization of $10 billion and free cash flow of $500 million. Its price to free cash flow ratio is 20x, because $10 billion divided by $500 million equals 20.
Example: If free cash flow rises to $1 billion while market capitalization stays at $10 billion, P/FCF falls to 10x. The lower ratio has different meaning depending on the cause. Operating improvement can make the lower ratio more informative, while deferred capex can make the same lower ratio less reliable.
P/FCF should not be read as a mechanical cheap-or-expensive label. The ratio becomes more useful after the investor checks whether the free-cash-flow base is repeatable.
Low P/FCF does not automatically mean undervaluation
A low price to free cash flow ratio can come from a low market valuation, strong free cash flow, or both. It can also come from a denominator that is temporarily inflated.
Common limitation
Low P/FCF is not automatic undervaluation. High P/FCF is not automatic overvaluation. Negative free cash flow can make the ratio non-comparable or not meaningful.
A low ratio is stronger when free cash flow is durable, cash conversion is clean, reinvestment needs are sustainable, and the company is being compared with appropriate peers. It is weaker when the denominator is distorted by one-time working-capital benefits, underinvestment, asset sales, cyclicality, or a temporary cash-flow peak.
How P/FCF differs from nearby valuation multiples
P/FCF is one valuation lens, not a replacement for every other multiple. It focuses on cash flow after capital expenditures, while other ratios focus on different denominators.
| Multiple | Main denominator | Useful distinction |
|---|---|---|
| P/FCF | Free cash flow | Focuses on cash left after operating needs and capital expenditures |
| Price-to-earnings ratio | Earnings or EPS | Uses accounting profit, which can differ from cash generation |
| Price-to-book ratio | Book value | Compares equity value with balance-sheet net asset value |
| PEG ratio | P/E relative to growth | Adds a growth assumption to the valuation comparison |
P/FCF is often most helpful when earnings are affected by non-cash charges or accounting differences. It is less helpful when free cash flow is negative, unstable, or shaped by capital spending that is not comparable across companies.
When price to free cash flow is most useful
P/FCF is usually more useful when a company has recurring cash generation, stable reinvestment needs, and a business model where free cash flow is a meaningful measure of economic output.
It can be less useful for early-stage companies, heavy reinvestment periods, deeply cyclical businesses, financial companies, and situations where free cash flow is negative or unusually volatile. In those cases, the ratio may need to be supplemented with normalized cash flow, balance-sheet analysis, earnings quality review, or a different valuation method.
Practical interpretation sequence: Start with the formula, then check the free-cash-flow base, then compare similar companies or similar periods, then review whether the denominator is normal, distorted, or negative.
FAQ
Is lower P/FCF always better?
No. A lower P/FCF can indicate a cheaper cash-flow valuation, but it can also reflect business risk, cyclical pressure, temporary cash-flow strength, weak growth, or market skepticism about future cash generation.
Can P/FCF be negative?
The ratio can become negative when free cash flow is negative, but the result is usually hard to interpret. In many cases, negative free cash flow makes P/FCF non-comparable or not meaningful.
What makes price to free cash flow misleading?
P/FCF can be misleading when free cash flow is temporarily boosted by working capital, reduced capex, asset sales, cyclical peaks, or other non-recurring effects. It can also mislead when companies being compared have very different reinvestment needs.