
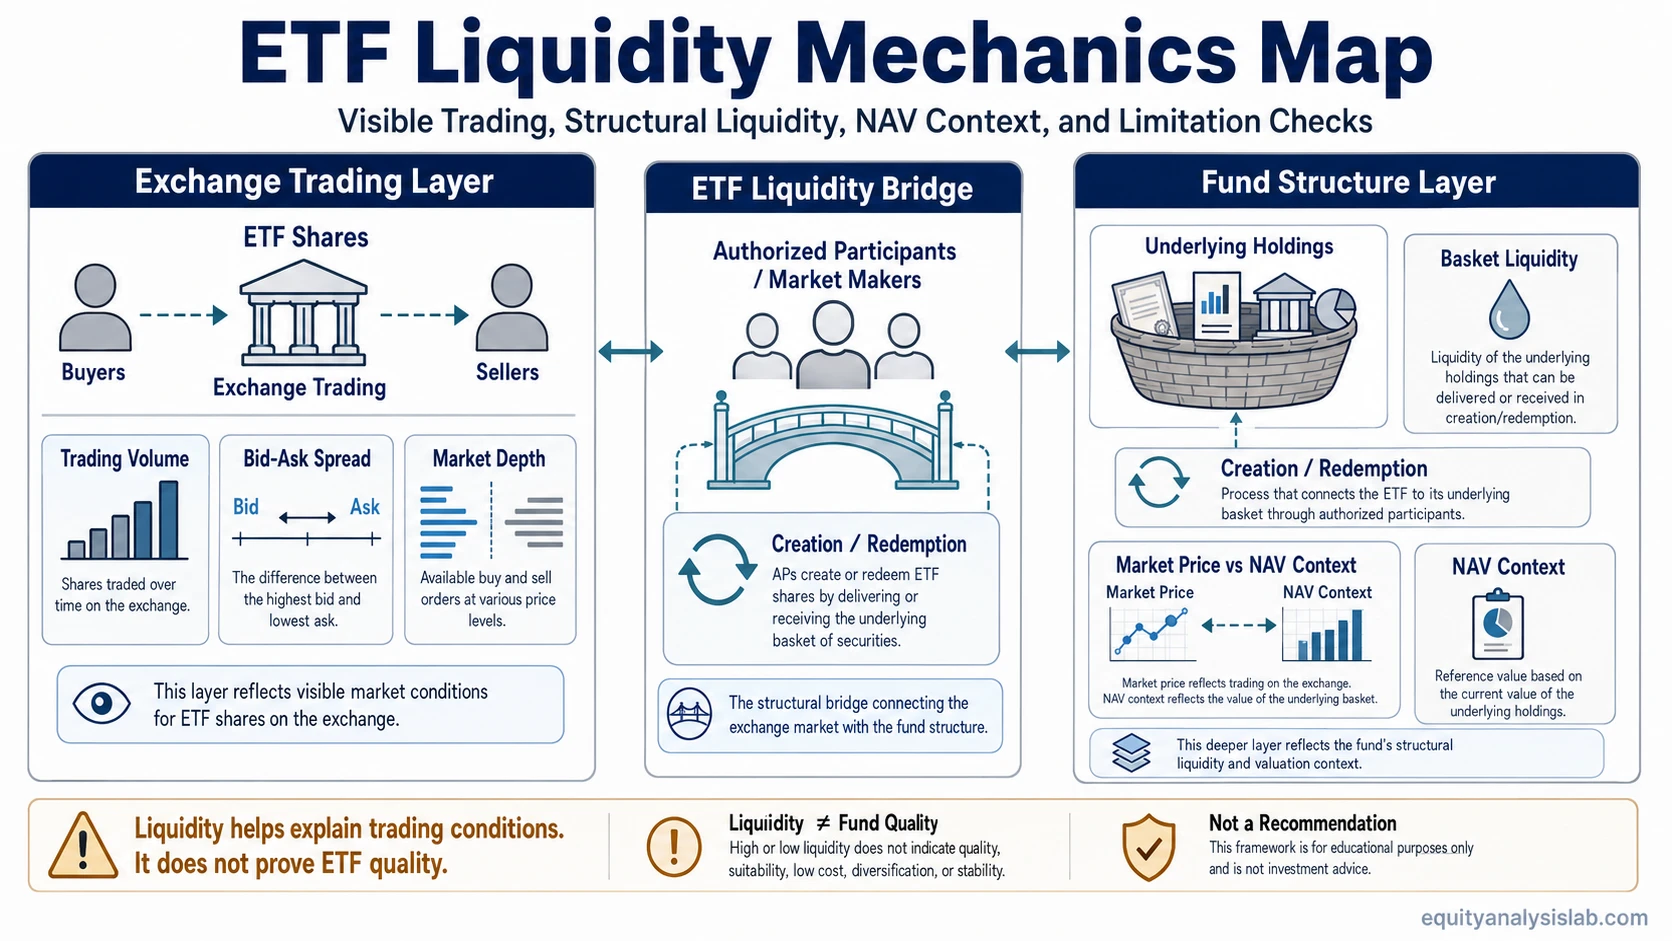
ETF liquidity is the ability to buy or sell ETF shares with limited price impact and reasonable transaction cost. For ETFs, liquidity has two layers: the exchange market where ETF shares trade and the deeper fund mechanism supported by underlying holdings and share creation or redemption.
This makes ETF liquidity different from the liquidity of an ordinary stock. A stock’s trading activity is mainly about the shares already available in the market. An ETF wrapper can also connect exchange trading with the securities, cash instruments, or other exposures held inside the fund.
ETF liquidity affects trading friction and execution conditions, but it does not establish fund quality, suitability, diversification, cost efficiency, tax efficiency, or future returns.
What Is ETF Liquidity?
ETF liquidity describes how easily ETF shares can trade without a large difference between the expected price and the actual execution price. It depends on visible exchange conditions such as quoted spreads, trading volume, and market depth, as well as structural conditions such as the liquidity of the underlying holdings and the ability of market participants to create or redeem ETF shares.
Visible liquidity shows what is currently available on the exchange. Structural liquidity helps explain how much additional trading capacity may exist through the underlying basket and the ETF creation and redemption process.
Key Points
- ETF trading volume is only one part of ETF liquidity.
- Bid-ask spread and market depth help show current secondary-market execution conditions.
- The liquidity of the underlying basket can support or constrain ETF liquidity beyond visible share volume.
- A tight spread for a small order does not guarantee the same execution quality for a larger order.
- Creation and redemption can support ETF liquidity, but the mechanism depends on market participants and underlying-market conditions.
ETF Liquidity Is Not Just Trading Volume
Trading volume shows how many ETF shares have recently changed hands, but it does not describe the entire liquidity profile. Two ETFs can report similar volume while having very different bid-ask spreads, market depth, and underlying basket liquidity.
Low volume can still matter because it may coincide with wider quotes, thinner displayed depth, or less frequent trading. The important distinction is that volume should be interpreted together with other liquidity evidence rather than used as a standalone score.
Same Trading Volume, Different ETF Liquidity
Consider two hypothetical ETFs that both trade an average of 50,000 shares per day. If volume is the only metric reviewed, they may appear equally liquid. The execution conditions can still be very different.
| Liquidity Metric | ETF A | ETF B |
|---|---|---|
| Average daily volume | 50,000 shares | 50,000 shares |
| Bid | $99.98 | $99.85 |
| Ask | $100.02 | $100.15 |
| Quoted spread | $0.04 | $0.30 |
| Spread as percentage of approximately $100 price | 0.04% | 0.30% |
| Displayed depth near best quotes | 8,000 shares | 600 shares |
| Underlying basket | Highly liquid large-cap stocks | Less-liquid securities |
Both ETFs show the same average share volume, but ETF A has a narrower spread, substantially more displayed depth, and a more liquid underlying basket in this example. The comparison illustrates why ETF volume alone cannot describe execution quality.
Interpretation: Similar trading volume does not imply similar ETF liquidity.
Secondary-Market ETF Liquidity
Secondary-market liquidity refers to ETF shares trading between buyers and sellers on an exchange. Investors can observe recent trading volume, quoted prices, and the bid-ask spread.
The spread is one visible transaction-cost signal. A narrower spread means buyers and sellers are quoting prices closer together, while a wider spread can indicate higher trading friction or greater uncertainty about execution value.
Market depth adds another dimension. The best bid or ask may apply to only a limited number of shares. A larger order may have to trade through several price levels, which can cause the average execution price to differ from the best visible quote.
Why Order Size Matters for ETF Liquidity
Assume an ETF has the following hypothetical ask-side order book:
| Ask Price | Shares Available |
|---|---|
| $100.02 | 500 |
| $100.05 | 1,000 |
| $100.10 | 1,500 |
A marketable buy order for 2,000 shares cannot be filled entirely at the best ask of $100.02 because only 500 shares are available there. In this simplified example, the order would consume multiple price levels.
500 × $100.02 = $50,010
1,000 × $100.05 = $100,050
500 × $100.10 = $50,050
Total cost = $200,110
Average execution price = $200,110 ÷ 2,000 = $100.055
The best displayed ask was $100.02, but the average execution price for the larger order was approximately $100.055. The example shows why liquidity is partly dependent on order size and available depth.
Size effect: A tight top-of-book spread does not reveal how a larger order will interact with the available market depth.
Primary-Market Liquidity and Creation/Redemption
ETF liquidity can also be supported through the primary market, where authorized participants can create or redeem ETF shares using the fund’s basket mechanism. This is one reason recent exchange trading volume does not necessarily represent the full amount of liquidity that may be available.
The creation and redemption mechanism allows ETF share supply to expand through creations or contract through redemptions when market participants choose to use the process.
Authorized participants have access to this mechanism, but their participation should not be treated as guaranteed. If underlying assets become harder to trade, hedging costs rise, or market participants reduce their willingness to intermediate, primary-market support can become more expensive or less effective.
Underlying Holdings and Basket Liquidity
The liquidity of an ETF is influenced by the assets inside the fund. An ETF holding highly liquid large-cap stocks may have a different liquidity profile from one holding thinly traded bonds, small-cap securities, bank loans, niche exposures, or less-liquid international securities.
Market makers and authorized participants may look through the ETF wrapper to the cost of trading or hedging the underlying basket. If those securities are easy to trade, structural liquidity may support ETF trading beyond what recent share volume suggests. If the basket is difficult to trade, the cost of providing liquidity can increase.
How to Review ETF Liquidity
| Check | What It Helps Evaluate |
|---|---|
| Trading volume | Recent activity in ETF shares. |
| Bid-ask spread | Visible quote friction between buyers and sellers. |
| Market depth | How much size is available near current quotes. |
| Underlying holdings | How easily the basket may be traded or hedged. |
| Creation/redemption conditions | Whether primary-market share supply can adjust efficiently. |
| Market price and NAV context | Whether exchange pricing is showing unusual premium or discount pressure. |
The six checks answer different questions. Volume describes recent activity, spread shows visible quote friction, depth shows available size, and the structural checks help explain whether liquidity may extend beyond the shares displayed on the exchange.
Common ETF Liquidity Misreadings
Low volume means the ETF cannot be liquid. Low volume can be a warning signal, but underlying basket liquidity and primary-market mechanisms can provide liquidity beyond recent exchange activity.
High volume proves strong liquidity. High volume does not guarantee a narrow spread, deep order book, liquid underlying basket, or stable execution during stressed markets.
A tight spread means every order will execute near the quote. The displayed spread describes the best prices for available size. Larger orders may reach deeper price levels.
ETF Liquidity, NAV, and Market Price
ETF liquidity is related to market price and NAV, but these concepts are not interchangeable. Market price is the exchange price where ETF shares trade. NAV is the fund’s per-share value based on its underlying holdings.
The ETF arbitrage process can help reduce gaps between market price and NAV when the underlying basket is tradable and creation/redemption is economically attractive. Premiums and discounts can still widen during market stress, thin trading periods, or when the underlying assets are difficult to price or trade.
Limits of ETF Liquidity Analysis
Liquidity describes trading conditions and execution friction. It does not determine whether an ETF has an appropriate portfolio, low expense ratio, low tracking error, attractive tax treatment, or a suitable role for a particular investor.
Liquidity conditions can also change. Spread, depth, underlying-market liquidity, and market-maker activity may look different during stressed markets than during normal trading conditions.
FAQ
Does low ETF volume mean poor ETF liquidity?
Not necessarily. Low volume can indicate weaker visible trading activity, but ETF liquidity also depends on spread, market depth, underlying holdings, and creation/redemption conditions.
Can two ETFs with the same trading volume have different liquidity?
Yes. Two ETFs can have similar trading volume while having different bid-ask spreads, market depth, underlying basket liquidity, and primary-market conditions. Volume alone does not describe the full execution environment.
How does order size affect ETF liquidity?
A larger order may require trading through several price levels if there are not enough shares available at the best quote. This can cause the average execution price to differ from the best displayed bid or ask.