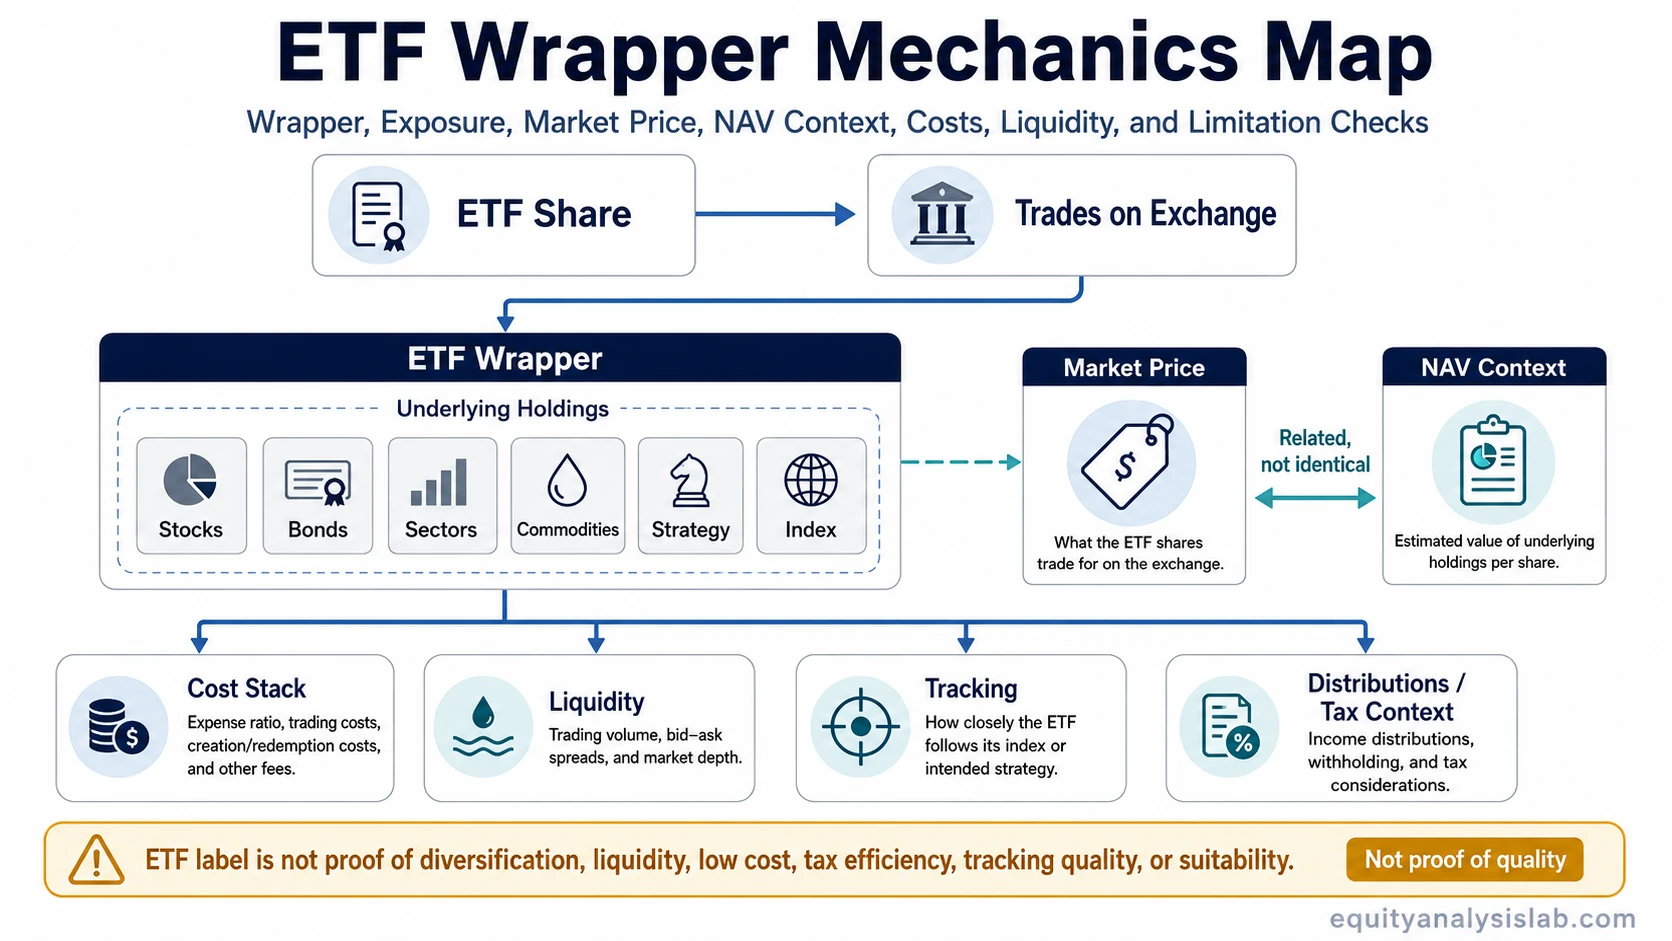
An ETF, or exchange-traded fund, is a fund wrapper that trades on an exchange while holding or tracking a basket, index, asset class, or investment strategy. It can trade like a stock during the market day, but its economic exposure comes from what the fund owns, how those holdings are weighted, how closely the fund tracks its objective, and how its market price relates to net asset value.
The ETF label does not prove diversification, liquidity, low cost, tax efficiency, tracking quality, or alignment with a specific investor’s objective. Two ETFs can both trade under ticker symbols and still behave very differently because their holdings, weighting rules, expense ratios, trading spreads, distribution policies, and tax considerations differ.
What is an ETF?
Definition: An ETF is an exchange-traded fund: a pooled investment vehicle whose shares are bought and sold on an exchange. The fund may seek to track an index, hold a defined group of securities, follow a rules-based strategy, or provide exposure to a specific asset class.
The important distinction is between the wrapper and the exposure. The wrapper tells the investor that the vehicle trades on an exchange. The exposure comes from the underlying holdings, index methodology, investment objective, weighting system, and portfolio construction rules.
Key points about ETFs
- ETF means exchange-traded fund. It is a fund structure whose shares trade on an exchange.
- An ETF is not the same as a single stock. A stock represents ownership in one company, while an ETF share represents ownership in a fund portfolio.
- An ETF is not the same as a traditional mutual fund. Both are pooled funds, but ETFs usually trade throughout the market day at market prices.
- ETF market price and NAV are related but not identical. The trading price can move above or below the fund’s net asset value.
- ETF cost is more than the expense ratio. Spreads, tracking difference, distributions, taxes, and trading conditions can also affect the investor’s realized experience.
How an ETF wrapper creates market exposure
An ETF wrapper turns a portfolio or strategy into exchange-traded shares. The investor buys ETF shares, and the fund holds the underlying assets according to its mandate. Those assets may be stocks, bonds, commodities exposure, sector baskets, factor portfolios, international securities, or other eligible instruments depending on the fund design.
The wrapper alone is only the starting point. A broad index ETF, a sector ETF, a bond ETF, and a thematic ETF may all use the ETF structure, but they do not create the same risk profile. The fund’s holdings, concentration, weighting method, rebalancing rules, and objective determine what the investor is actually exposed to.
A useful way to read an ETF is to separate the ticker from the mechanism. The ticker makes the vehicle tradable. The fund documents, holdings list, objective, index or strategy, and cost disclosures explain what the ticker represents.
ETF vs stock vs mutual fund
ETFs can be confusing because they combine features that investors associate with both stocks and funds. They trade on exchanges like stocks, but the underlying exposure usually comes from a portfolio rather than one operating company.
| Vehicle | What it represents | How it usually trades or prices | Main interpretation point |
|---|---|---|---|
| ETF | Shares of a fund that holds or tracks a basket, index, asset class, or strategy | Trades on an exchange at market prices during the trading day | The ETF share is tradable, but exposure depends on the underlying fund portfolio |
| Stock | Ownership interest in one company | Trades on an exchange at market prices during the trading day | The investor is exposed mainly to one company’s business, valuation, and ownership structure |
| Mutual fund | Shares of a pooled fund portfolio | Often priced once per day at net asset value after the market close | The investor receives fund exposure, but the trading and pricing process differs from an ETF |
An ETF can therefore look stock-like on a brokerage screen while behaving economically like a fund. The practical question is not only “What is the ticker?” but “What does the fund own, how is it structured, and how does its trading price connect to portfolio value?”
ETF market price, NAV, and trading mechanics
An ETF has a market price because its shares trade between buyers and sellers on an exchange. It also has a net asset value, or NAV, which reflects the value of the fund’s underlying holdings after accounting for fund-level assets and liabilities. The market price and NAV are connected, but they do not have to be identical at every moment.
The difference between the buyer-side quote and seller-side quote is the bid-ask spread. A narrow spread can make trading less costly, while a wider spread can raise the effective cost of entering or exiting a position. The spread is separate from the stated expense ratio and can change with trading conditions.
Large ETF market-price gaps from NAV may invite a creation and redemption process involving authorized participants. The ETF creation and redemption mechanism helps connect ETF share supply with the underlying portfolio, but it does not remove every trading cost, liquidity constraint, or market stress condition.
When the ETF market price moves away from the value of the underlying basket, arbitrage activity around NAV can help pull price and value back toward alignment. That relationship is a mechanism, not a guarantee that every ETF will always trade exactly at NAV.
ETF costs: expense ratio, spread, and tracking
The expense ratio is the most visible ETF cost, but it is not the full cost picture. A low stated expense ratio can still be paired with a wider trading spread, meaningful tracking difference, distribution complexity, or tax outcomes that matter for the investor’s actual result.
| Cost or friction | What it means | Why it matters |
|---|---|---|
| Expense ratio | The ongoing fund-level fee expressed as a percentage of assets | It is deducted at the fund level and affects the investor’s net fund experience |
| Bid-ask spread | The gap between the price buyers bid and sellers ask | It affects the cost of trading ETF shares |
| Brokerage commissions or platform fees | Trading costs that may apply depending on account and platform | They can matter more for frequent or small transactions |
| Tracking difference | The gap between fund performance and the index or objective it seeks to follow | It shows whether the ETF experience matches the intended exposure closely |
| Distributions | Income or gains passed through to shareholders when applicable | They can affect cash flow, reinvestment behavior, and taxable events |
| Tax structure | The way ETF structure, holdings, turnover, distributions, and investor jurisdiction interact | It can affect after-tax outcomes and should not be assumed from the ETF label alone |
Cost analysis is therefore a stack. The expense ratio is one layer, while trading spread, tracking, distribution behavior, tax considerations, and liquidity conditions form additional layers.
ETF types as examples, not proof of quality
ETF types can help describe the intended exposure, but they do not prove that the fund is diversified, liquid, low risk, efficiently priced, or aligned with a specific investor’s objective. A stock ETF, bond ETF, sector ETF, commodity-linked ETF, international ETF, factor ETF, or thematic ETF can each carry different portfolio behavior.
For example, two ETFs can both be labeled as equity ETFs. One may hold a broad, diversified basket with many securities, while another may concentrate heavily in a small number of companies or one narrow theme. The wrapper is the same category of vehicle, but the investor exposure is not the same.
A second difference can appear in trading. One ETF may trade with deep order-book activity and relatively tight spreads, while another may have thinner trading conditions. The question is whether trading depth is sufficient for the intended use, which is part of how ETF liquidity should be interpreted.
What an ETF does not prove
An ETF does not automatically prove diversification. A fund can hold many securities and still be concentrated by sector, country, factor, issuer, maturity, currency, or weighting method.
An ETF does not automatically prove liquidity. The trading screen may show a ticker and quote, but the useful liquidity picture includes bid-ask spread, trading volume, underlying holdings, creation/redemption capacity, and market conditions.
An ETF does not automatically prove low cost. The expense ratio is only one cost layer, and it should be read together with spread, tracking difference, tax considerations, distributions, and transaction costs where applicable.
An ETF does not automatically prove tax efficiency. Structure can matter, but tax treatment depends on the fund, holdings, distributions, turnover, jurisdiction, account type, and investor-specific circumstances.
An ETF does not automatically prove investment quality. The fund may provide clean access to an exposure, but the quality of that exposure depends on the underlying assets, methodology, valuation context, risk profile, and investor objective.
What to check before interpreting an ETF
A practical ETF review starts with observable features rather than the label alone. The goal is to understand what the ETF actually represents and how the fund structure can affect the investor’s experience.
| Observable | Question to ask | Interpretation boundary |
|---|---|---|
| Holdings | What does the ETF actually own or reference? | The ticker does not reveal the portfolio by itself |
| Weighting | Are holdings broad, concentrated, market-cap weighted, equal weighted, or rules based? | Many holdings can still create concentrated exposure |
| Objective, index, or strategy | What exposure is the fund designed to provide? | The objective defines the target, not a guaranteed outcome |
| Expense ratio | What ongoing fund-level fee applies? | Low expense ratio does not capture all costs |
| Bid-ask spread | How wide is the trading quote? | The spread can affect realized trading cost |
| Liquidity | How does trading depth compare with the underlying asset liquidity? | ETF liquidity is not only the exchange volume shown for the ticker |
| NAV premium or discount | Does market price trade above or below portfolio value? | Market price and NAV can diverge, especially under stressed conditions |
| Tracking difference | How closely does the fund follow its benchmark or stated objective? | Tracking can be affected by fees, sampling, cash drag, turnover, and market frictions |
| Distribution policy | Does the ETF distribute income, gains, or other cash flows? | Distributions can change cash-flow and reinvestment behavior |
| Tax structure | How can structure, holdings, turnover, and distributions affect taxable treatment? | Tax impact is not uniform across all ETFs or all investors |
Simple ETF interpretation example
Consider two hypothetical ETFs that both trade on an exchange and both describe themselves as equity ETFs. ETF A holds a broad basket with many sectors, small position weights, a tight trading spread, and a history of close tracking to its stated objective. ETF B holds a narrower group of companies, has heavier concentration in one theme, trades with a wider spread, and shows more tracking difference over time.
Both vehicles are ETFs, but the investor’s exposure is not the same. The label describes the wrapper. The holdings, weighting, trading conditions, cost stack, tracking behavior, distributions, and tax structure explain the actual economic experience.
Related ETF mechanics
ETF interpretation becomes clearer when the wrapper is separated from the mechanics that shape price, liquidity, and cost. Market-price trading connects directly to spread behavior, while NAV alignment depends partly on creation/redemption and arbitrage mechanics.
- Use bid and ask quotes to understand the immediate trading-cost layer around ETF market price.
- Use creation and redemption mechanics to understand how ETF share supply can adjust around underlying portfolio value.
- Use ETF arbitrage mechanics to understand why market price and NAV can move back toward each other, while still allowing temporary gaps.
- Use ETF liquidity analysis to separate ticker-level trading activity from underlying holdings liquidity.
ETF FAQ
What does ETF stand for?
ETF stands for exchange-traded fund. It is a fund structure whose shares trade on an exchange while representing exposure to an underlying portfolio, index, asset class, or strategy.
Is an ETF the same as a stock?
No. An ETF may trade on an exchange like a stock, but an ETF share represents ownership in a fund portfolio. A stock represents ownership in one company.
Is an ETF the same as a mutual fund?
No. ETFs and mutual funds are both pooled investment vehicles, but ETFs usually trade throughout the market day at market prices, while many mutual funds price once per day at net asset value.
Can an ETF trade away from NAV?
Yes. An ETF’s market price can trade above or below net asset value. Creation/redemption and arbitrage mechanics can help align the two, but temporary premiums or discounts can still occur.
Are ETFs always diversified?
No. Some ETFs are broad, while others are concentrated by sector, country, theme, factor, issuer, asset class, maturity, or weighting method. Diversification depends on the actual holdings and construction rules.
What costs should an ETF investor check?
The main cost layers include expense ratio, bid-ask spread, any applicable trading costs, tracking difference, distribution effects, and tax considerations where relevant. The expense ratio alone is not the full cost picture.