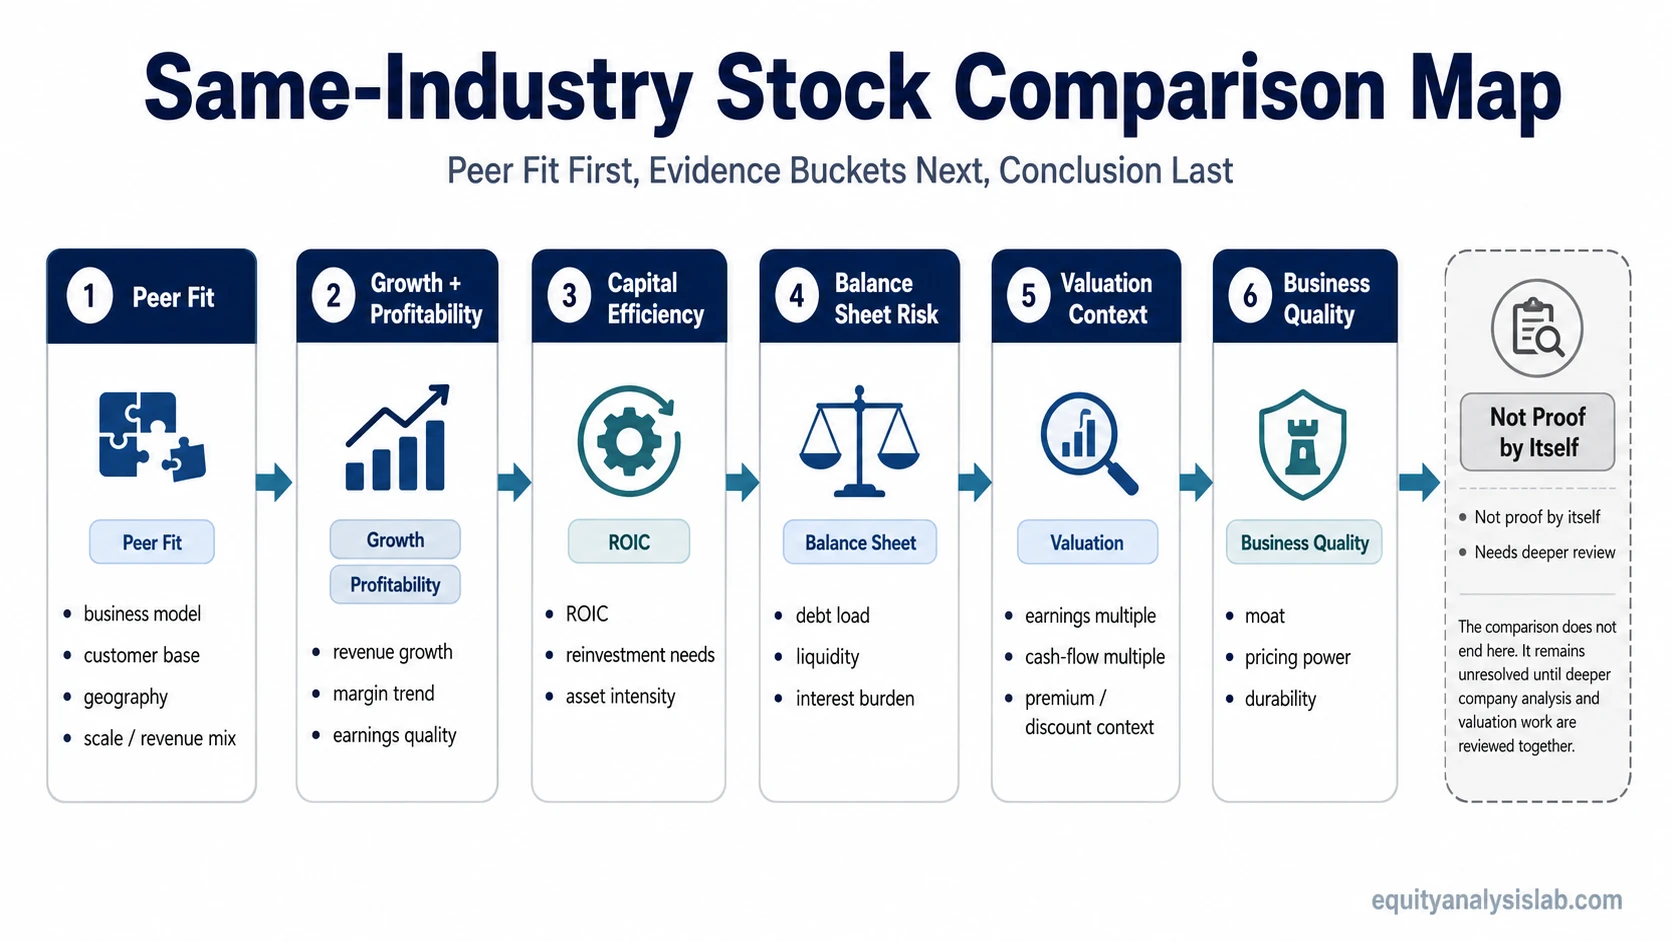
To compare stocks in the same industry, start by comparing similar companies against the same business context: peer group fit, growth, profitability, capital efficiency, balance sheet strength, valuation, and business quality.
Same-industry comparison organizes evidence. It does not prove that a stock is attractive by itself, because a company can look cheap, profitable, or fast-growing for reasons that still require deeper review.
Definition: Same-industry stock comparison means evaluating peer companies that operate in a similar business environment, then checking whether differences in margins, returns, valuation, leverage, and competitive position explain why one company deserves a different market valuation from another.
Key Points
- Peer comparison works best when the companies share a similar industry, business model, customer base, geography, and revenue mix.
- Stock price alone is not a useful comparison metric; business evidence has to be compared against valuation.
- Growth, margins, ROIC, balance sheet risk, valuation multiples, and business quality should be reviewed together rather than as isolated scores.
- Comparison tools can organize data, but the investor still has to interpret why the numbers differ.
How Same-Industry Stock Comparison Works
A useful peer review starts with a simple question: which companies are exposed to a similar business problem, and which evidence explains their differences? A retailer should usually be compared with other retailers that share similar formats, customer segments, cost structures, and geographic exposure. A software company should usually be compared with software peers that have similar revenue models, retention profiles, margin structures, and reinvestment needs.
The comparison becomes useful when it separates three layers: business performance, financial quality, and valuation context. A company with faster growth may still deserve caution if margins are deteriorating, capital efficiency is weak, debt risk is rising, or the valuation already prices in strong execution.
Limitation: Peer comparison is a starting point for investigation, not a final investment conclusion. It can show which company deserves more research, but it cannot replace company-specific analysis, valuation work, risk review, or portfolio fit.
Start With the Right Peer Group
The peer group controls the quality of the comparison. Two companies can sit inside the same broad sector and still be poor peers if they sell to different customers, operate with different margins, use different financing structures, or face different regulation.
| Peer group check | Why it matters | Weak comparison example |
|---|---|---|
| Business model | Margins, capital needs, revenue durability, and reinvestment requirements differ by model. | Comparing a subscription software firm with a hardware reseller. |
| Sub-industry | Broad sector labels can hide very different economics. | Comparing a specialty insurer with a consumer bank only because both are financial companies. |
| Customer base | Consumer, enterprise, government, and wholesale customers create different demand patterns. | Comparing a luxury retailer with a discount retailer without adjusting for customer behavior. |
| Geography | Currency, regulation, tax, labor cost, and market maturity can distort peer multiples. | Comparing a domestic-only business with a global peer without noting exposure differences. |
| Scale and revenue mix | Larger companies may have purchasing power, lower unit costs, or more diversified revenue. | Comparing a single-product company with a diversified conglomerate as if both had the same risk profile. |
Compare Business Quality, Margins, Capital Efficiency, and Valuation
Once the peer group is clean, the review should move from surface numbers to evidence buckets. The goal is not to find the company with the highest number in one column. The goal is to understand whether the company’s business quality, financial results, and valuation tell a consistent story.
| Evidence bucket | What to compare | Useful interpretation |
|---|---|---|
| Growth | Revenue growth, earnings growth, market share, and durability of demand. | Higher growth is more meaningful when it is durable, profitable, and not dependent on excessive dilution or leverage. |
| Profitability | Gross margin, operating margin, net margin, and margin trend. | Margin differences can reveal pricing power, cost structure, product mix, or competitive pressure. |
| Capital efficiency | Return on invested capital, reinvestment needs, and asset intensity. | A company that earns stronger returns on capital may deserve a different valuation than a peer that requires more capital to produce similar growth. |
| Balance sheet risk | Debt load, liquidity, interest burden, maturity schedule, and cash reserves. | A cheaper valuation can reflect real balance sheet risk rather than a simple market mispricing. |
| Valuation | Earnings multiples, sales multiples, cash-flow multiples, and peer-relative valuation. | A higher or lower earnings multiple only has meaning when compared with growth quality, margins, durability, and risk. |
| Business quality | Economic moat, pricing power, customer retention, switching costs, and competitive durability. | Durable advantage can explain why two companies in the same industry trade at different multiples. |
Which Evidence to Check Next in Peer Analysis
A stronger peer review connects each question to the right evidence type. That prevents one metric from carrying more weight than it deserves.
| Comparison question | Evidence type | What it helps compare | Next evidence check |
|---|---|---|---|
| Are these companies really comparable? | Peer group fit | Business model, end market, customer base, geography, scale, and revenue mix. | Use the peer group checks before comparing any metric. |
| Which company has better profitability quality? | Margin structure | Pricing power, cost control, product mix, and operating leverage. | Review gross margin before relying on headline earnings growth. |
| Which company converts capital into stronger business returns? | Capital efficiency | How much profit the company earns relative to the capital required. | Compare return on invested capital when growth requires heavy reinvestment. |
| Does one company deserve a higher valuation multiple? | Relative valuation | Whether a premium or discount is supported by growth, margins, durability, and risk. | Use the earnings multiple context as one valuation lens, not as a complete answer. |
| Is the stronger-looking company protected by durable advantage? | Business quality | Moat, pricing power, switching costs, brand strength, network effects, or cost advantage. | Check whether an economic moat explains the peer difference. |
| Should a tool be used to narrow the peer list? | Screening workflow | Comparable companies, valuation ranges, profitability thresholds, and balance sheet filters. | A screening filter workflow can narrow candidates before deeper comparison. |
How Comparison Tools Fit Into the Process
Comparison tools are useful for gathering peer data quickly. They can show market cap, valuation multiples, growth rates, profitability, debt ratios, analyst estimates, and price performance in one place. That makes them useful for screening and organizing the first pass.
The interpretation still has to happen beyond the dashboard. A tool can show that one company has a higher margin or lower multiple, but the reason may involve better business quality, weaker growth, higher leverage, accounting differences, cyclicality, or a temporary industry shock.
Tool boundary: A stock comparison tool can organize peer data, but it should not be treated as a ranking engine. The evidence still has to be checked against business model fit, accounting quality, risk, and valuation assumptions.
Common Mistakes When Comparing Industry Peers
- Using the wrong peer group: broad sector labels can hide different business models, customer bases, and margin structures.
- Comparing stock price instead of valuation: a $20 stock is not automatically cheaper than a $200 stock.
- Relying on one metric: a low multiple, high margin, or high growth rate can be misleading without balance sheet and quality context.
- Ignoring debt and liquidity: a peer may look inexpensive because financial risk is higher.
- Overweighting short-term performance: recent price strength can reflect sentiment, positioning, or a temporary earnings cycle rather than durable business advantage.
- Confusing screening with analysis: filters can narrow a list, but they do not explain why one business deserves a premium or discount.
Simple Same-Industry Stock Comparison Example
Two companies operate in the same sub-industry and sell to similar customers. Company A grows revenue faster and trades at a higher earnings multiple. Company B grows more slowly but has steadier margins, lower debt, and stronger returns on capital.
The first read is incomplete if it only compares growth or valuation. Company A may justify a premium only if revenue growth is durable, margins can scale, and reinvestment does not weaken returns on capital. Company B may deserve more review if steadier margins, lower leverage, and stronger returns on capital explain why its slower growth is less risky. The comparison remains unresolved until peer fit, margin trend, capital efficiency, balance sheet risk, and valuation assumptions are reviewed together.
When Same-Industry Comparison Is Most Useful
Same-industry comparison is most useful when the investor already has a defined peer set and wants to understand which company deserves deeper research. It works best as a disciplined evidence map: first check whether the peers are comparable, then compare the most relevant business and valuation evidence, then identify which differences require further analysis.
The process becomes weaker when the companies share only a broad sector label or when the comparison is reduced to a single valuation multiple. A peer comparison should narrow the research question, not replace it.
FAQ
What is the best way to compare stocks in the same industry?
The best starting point is to compare similar companies across peer fit, growth, margins, capital efficiency, balance sheet risk, valuation, and business quality. No single metric is enough on its own.
Should stocks be compared by price or valuation?
Stocks should be compared by valuation and business evidence, not by share price alone. A lower share price does not mean a company is cheaper, and a higher share price does not mean it is more expensive.
Why is peer group selection important?
Peer group selection matters because different business models, customer bases, regions, and capital needs can make companies look comparable when their economics are actually different.
Can peer comparison make an investment decision by itself?
No. Peer comparison can highlight which companies deserve deeper research, but the conclusion still depends on company quality, valuation assumptions, risk, and portfolio context.