
To analyze a stock, start with the business, then test the story against financial statements, growth, profitability, cash flow, business quality, valuation, and risk before forming an investor view. A chart, valuation ratio, strong narrative, or earnings number can start the research, but no single input is enough to evaluate the company as an investment.
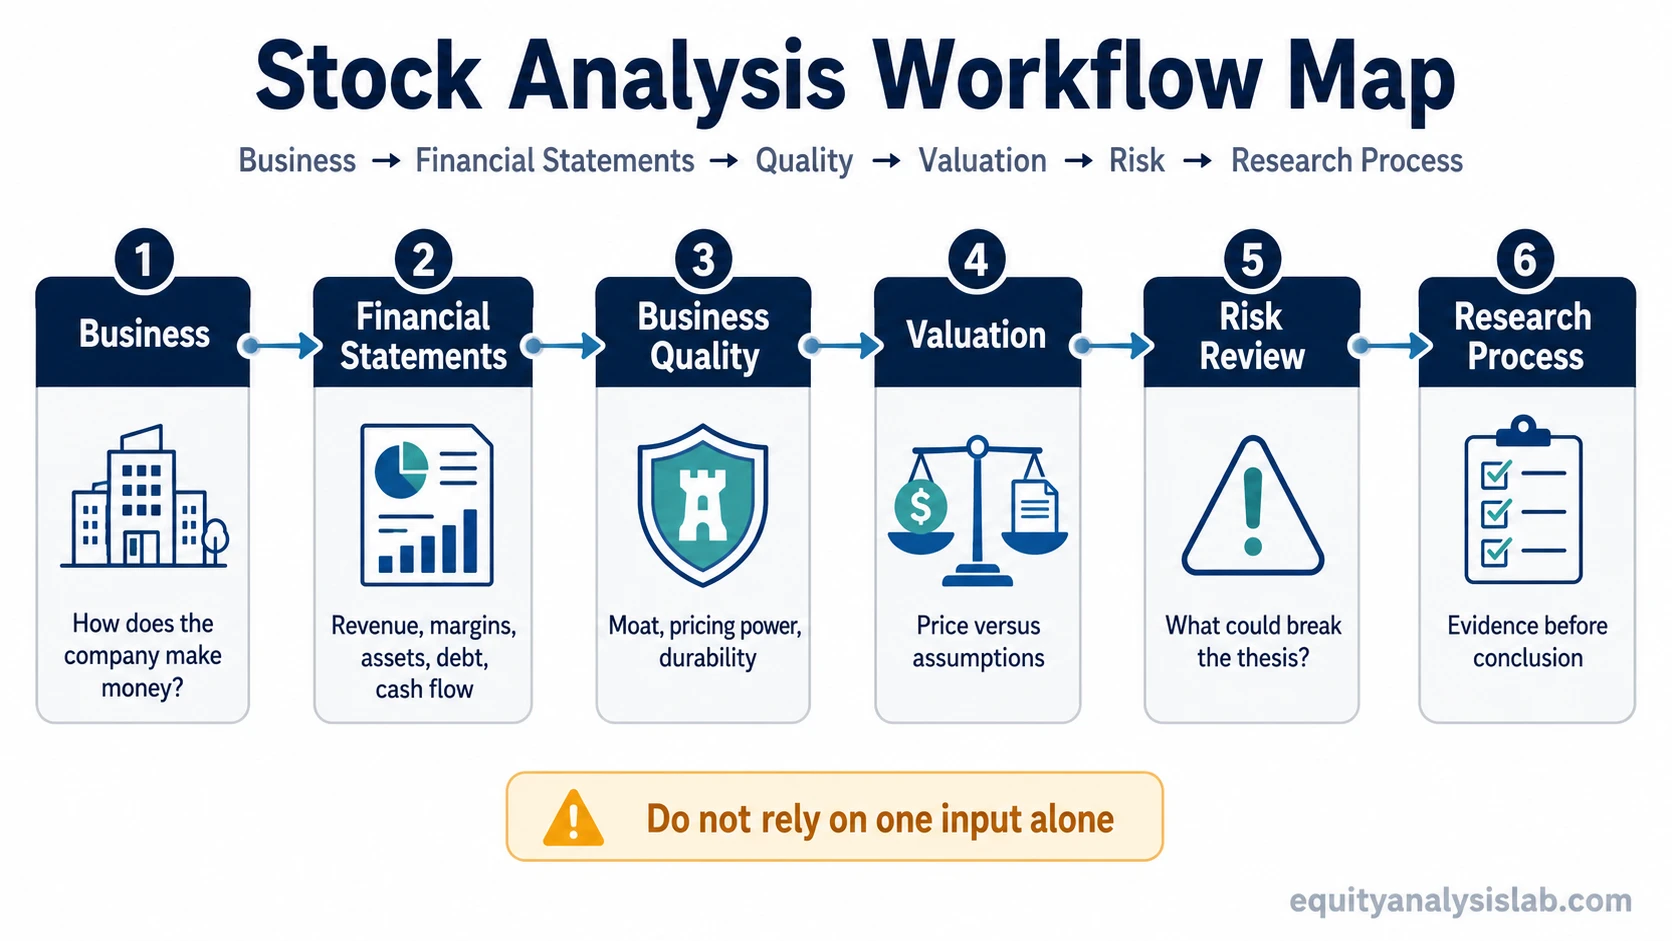
The sequence matters. Strong financial performance can still be paired with an unattractive valuation, while a low valuation can reflect deteriorating business economics. Technical analysis can later provide market-behavior or timing context, but it should remain separate from the question of whether the underlying company is financially and competitively sound.
Key Points
- Stock analysis begins with the company and its business model, not only with the ticker or recent price movement.
- Revenue, margins, earnings, balance-sheet strength, and cash flow should be read together.
- Business quality tests whether growth and profitability may be durable rather than temporary.
- Valuation asks what expectations are already reflected in the stock price.
- Risk analysis identifies what could weaken or break the investment thesis.
- Technical structure can add timing and market-behavior context, but it does not replace fundamental company analysis.
- A repeatable process is more useful than relying on one ratio, story, chart pattern, or forecast.
How to Analyze a Stock Step by Step
A practical stock-analysis process should move in a consistent order so that one attractive number, story, or chart does not dominate the conclusion.
| Step | Question to Answer | Why It Matters |
|---|---|---|
| 1. Understand the business | What does the company sell, who pays it, and what drives demand? | The financial statements are easier to interpret when the underlying business model is understood first. |
| 2. Read the financial statements together | What do revenue, profitability, financial position, and cash flow show when viewed as one system? | A single statement can hide weaknesses that become visible when the statements are compared. |
| 3. Test growth quality | Is growth translating into stronger margins, cash generation, and per-share economics? | Growth is more valuable when the economics supporting it are improving rather than deteriorating. |
| 4. Check business quality | Are the current economics supported by durable competitive advantages, customer behavior, and sound capital allocation? | Business quality affects how much confidence can be placed in future assumptions. |
| 5. Evaluate valuation | What expectations for growth, margins, and cash flow are already reflected in the price? | A strong company can still be a weak investment setup when the valuation requires too much future success. |
| 6. Define risks and thesis breakers | What specific developments would materially weaken the investment case? | Risk becomes more useful when it is defined before the conclusion is emotionally fixed. |
| 7. Form the thesis and monitoring plan | What is supported by evidence, what remains an assumption, and what needs to be checked next? | The final conclusion should be updateable as new information arrives rather than treated as a permanent label. |
What to Gather Before You Analyze a Stock
A stock analysis is easier to keep evidence-based when the core source material is collected before the conclusion is formed. The exact documents vary by company and market, but the same basic evidence set works for most public companies.
| Source | What It Helps Answer | What to Extract |
|---|---|---|
| Latest annual report | How does the business make money, what are the major risks, and what has changed over a full year? | Business segments, revenue drivers, margins, cash flow, debt, share count, major risks, and management discussion. |
| Most recent quarterly report | What has changed since the annual report? | Latest revenue, margins, cash flow, balance-sheet changes, guidance-related developments, and new risks. |
| Latest earnings release and call | How does management explain the newest operating results? | Current operating metrics, guidance, demand commentary, margin drivers, capital allocation, and unanswered questions. |
| Investor presentation or operating-metric disclosures | Which non-GAAP or industry-specific measures does management use to explain the business? | Customer, unit, retention, backlog, segment, pricing, or other business-specific measures that can be reconciled with the financial statements. |
| Current market and capital-structure data | What is the market currently paying for the company? | Share price, diluted share count, market capitalization, cash, debt, and the inputs required for relevant valuation measures. |
| Relevant peer information | How do growth, profitability, balance-sheet quality, and valuation compare with similar businesses? | Comparable business models, operating metrics, margins, growth rates, capital intensity, and valuation differences. |
Step 1: Understand the Business
A stock represents an ownership interest in a business. Before reviewing valuation multiples or price charts, identify how that business actually creates revenue and what could cause that revenue to grow, slow, or disappear.
| Business Question | What to Identify | Why It Matters |
|---|---|---|
| What does the company sell? | Products, services, subscriptions, licenses, advertising, financing, or another revenue source. | The revenue model determines which operating metrics deserve attention. |
| Who pays the company? | Consumers, enterprises, governments, advertisers, developers, or other customer groups. | Customer type affects demand durability, concentration, and economic sensitivity. |
| Why do customers choose it? | Price, product quality, switching costs, network effects, brand, convenience, scale, or another advantage. | The answer begins the business-quality and competitive-position analysis. |
| What drives growth? | New customers, higher prices, greater usage, new products, geographic expansion, acquisitions, or market growth. | Different growth drivers carry different durability and capital requirements. |
| What can weaken demand? | Competition, substitution, economic slowdown, regulation, customer concentration, technological change, or execution failure. | The same factors can later become thesis breakers. |
Step 2: Read the Financial Statements Together
Financial statements turn the business story into measurable evidence. They answer different questions and become more useful when they are compared rather than read in isolation.
| Statement | Main Question | Useful Evidence |
|---|---|---|
| Income statement | How did the company perform during the period? | Revenue, gross profit, operating expenses, operating income, taxes, and net income. |
| Balance sheet | What does the company own, owe, and retain? | Cash, assets, liabilities, debt, liquidity, working capital, and shareholders’ equity. |
| Cash-flow statement | How did cash actually move through the business? | Operating cash flow, capital spending, financing activity, and cash conversion. |
One statement can produce a misleading impression when separated from the others. Revenue can rise while margins weaken. Net income can rise while operating cash flow deteriorates. Cash can increase because debt was issued rather than because the business generated more cash.
Step 3: Separate Growth From Growth Quality
Growth is important, but the percentage growth rate alone does not show whether shareholder economics are improving. Revenue should be traced through margins, earnings, cash flow, and share count.
| Growth Evidence | What It Can Show | What Still Needs Checking |
|---|---|---|
| Revenue growth | The business is generating more top-line activity. | Margins, customer economics, cash conversion, and capital required to support the growth. |
| Operating-income growth | Operating profit is increasing. | Whether the improvement is recurring and supported by normal operations. |
| EPS growth | Earnings attributable per share are increasing. | Share-count changes, one-time items, taxes, margins, and cash-flow support. |
| Free-cash-flow growth | More cash may remain after operating requirements and capital spending. | Working-capital timing, capital expenditure cycles, and whether the improvement is durable. |
| Customer or usage growth | Demand or adoption may be expanding. | Retention, pricing, acquisition cost, monetization, and unit economics. |
Growth check: ask not only whether the business is growing, but whether that growth is becoming more valuable per share.
Step 4: Check Business Quality and Competitive Position
Business quality asks whether favorable results can persist. A company can grow quickly for several years without developing durable competitive economics.
| Quality Area | Evidence to Review | Main Risk |
|---|---|---|
| Customer retention | Renewal behavior, churn, recurring revenue, repeat purchases, and customer concentration. | Growth can weaken quickly if customers leave or depend too heavily on one buyer. |
| Pricing power | Ability to maintain or increase prices without destroying demand. | Revenue growth may be less valuable when competition forces lower pricing. |
| Unit economics | Gross margin, acquisition cost, lifetime economics, contribution margin, or other relevant measures. | Scale can make a weak business larger without making it better. |
| Competitive advantage | Switching costs, network effects, cost advantages, brand, scale, intellectual property, or distribution. | An apparent advantage can erode as competitors or technology change. |
| Capital allocation | Reinvestment, acquisitions, debt reduction, dividends, buybacks, and share issuance. | Strong operating performance can be diluted by poor capital decisions. |
The economic moat framework can help organize durable competitive advantages, but the moat label should come after the evidence rather than replace it.
Step 5: Compare Valuation With the Business Evidence
Valuation asks what investors are paying for the company’s current and expected economics. It should come after the basic business and financial review because a valuation multiple without an understanding of the denominator can be misleading.
| Valuation Question | What to Compare | Why It Matters |
|---|---|---|
| What is the current multiple? | P/E, P/S, EV/EBITDA, free-cash-flow yield, or another relevant measure. | Creates a starting point for understanding what investors are paying. |
| What supports that multiple? | Growth, margins, return on capital, balance-sheet quality, business durability, and cash flow. | A premium multiple requires economic evidence that can justify the premium. |
| What assumptions are embedded? | Future revenue, margins, reinvestment, earnings, and cash-flow expectations. | The valuation becomes more fragile when optimistic assumptions are already required. |
| What happens if growth slows? | Alternative growth and margin scenarios. | A strong business can still experience poor stock returns when expectations reset. |
| What is the comparison set? | Relevant peers, historical valuation, and business-model differences. | Multiples are most useful when the companies and earnings bases are genuinely comparable. |
The How to Value a Stock guide covers valuation methods and assumption testing in greater detail.
Multiples are useful for comparison, but deeper valuation work can connect operating assumptions directly to estimated value. A cash-flow-based valuation can show how revenue growth, margins, reinvestment, discount rates, and terminal assumptions affect the result.
That result should still be treated as conditional. Intrinsic value depends on the assumptions used, so the useful output is usually a range and an understanding of which inputs drive it rather than one precise number.
Step 6: Identify Risks and Thesis Breakers
Risk review should happen before the conclusion becomes emotionally fixed. The objective is not to produce an exhaustive list of everything that could go wrong. It is to identify the conditions that could materially change the investment thesis.
| Risk Area | What to Check | Potential Thesis Effect |
|---|---|---|
| Revenue durability | Demand, customers, retention, pricing, product mix, and cyclicality. | Growth assumptions may need to be reduced. |
| Margins | Gross margin, operating margin, input costs, pricing power, and operating leverage. | Revenue growth can become less valuable if profitability deteriorates. |
| Cash conversion | Operating cash flow, free cash flow, working capital, and capital expenditure. | Reported earnings may deserve less weight when they do not translate into cash. |
| Debt and liquidity | Cash, leverage, maturities, interest expense, and financing requirements. | Financial pressure can reduce strategic flexibility or increase dilution risk. |
| Dilution | Share issuance, stock compensation, convertibles, and share-count trend. | Company growth may not translate proportionally into per-share value. |
| Competition | Pricing pressure, market share, new entrants, substitutes, and technology change. | Expected growth or margins may become less durable. |
| Valuation | Growth and profitability required to support the current price. | Results can disappoint investors even when the company continues growing. |
Step 7: Form the Investment Thesis and Monitoring Plan
The final stock-analysis output should separate what the company has already demonstrated from what the investor still expects to happen. This makes the conclusion easier to test when new earnings, guidance, competitive developments, or valuation changes arrive.
| Research Layer | What Belongs Here | Why It Should Stay Separate |
|---|---|---|
| Reported evidence | Historical revenue, margins, cash flow, debt, share count, operating metrics, and other verifiable company results. | These are observations about what has already happened rather than forecasts. |
| Forward assumptions | Expected growth, margins, reinvestment, competitive durability, cash generation, and valuation inputs. | An assumption can be reasonable without being a confirmed fact. |
| Thesis breakers | Specific developments that would materially weaken the core business, financial, or valuation reasoning. | Defining them in advance makes the thesis easier to falsify rather than defend after the facts change. |
| Monitoring items | The next earnings release, margin trend, cash conversion, customer metrics, debt position, competitive evidence, or valuation change that matters to the thesis. | Monitoring focuses future research on information that could actually change the conclusion. |
The final company view can then be written as an investment thesis that states the evidence, assumptions, valuation logic, risks, and conditions that would require the view to be revised.
The Investment Research Process extends this framework from company analysis into evidence collection, thesis development, decision boundaries, and ongoing monitoring.
See a Complete Stock Analysis Process in a Real Company Example
This historical DigitalOcean case shows how several analytical layers can be combined around one company: the business and cloud-infrastructure thesis, growth and profitability evidence, valuation context, market structure, and the conditions that could weaken the scenario.
Historical case: the video uses the DigitalOcean and market information available when it was recorded. The company’s financials, valuation, price structure, and industry conditions may have changed since then, so the case should not be treated as a current valuation, price target, or recommendation.
The transferable lesson is the workflow: a potentially interesting company theme is only the beginning. The thesis becomes more useful when business evidence, financial performance, valuation, risk, and market behavior can be checked separately before they are combined.
Where Technical Analysis Fits
Technical analysis can be added after the fundamental stock analysis when the investor also wants to study market behavior, trend, support and resistance, price acceptance, or entry timing.
| Question | Fundamental Analysis | Technical Analysis |
|---|---|---|
| What is being studied? | The business, financial condition, valuation, and thesis risk. | Price, volume, trend, structure, and market behavior. |
| Main purpose | Understand the company and what expectations are reflected in the price. | Understand how the market is currently behaving around that security. |
| Can it repair weakness in the other layer? | No. Strong fundamentals do not guarantee favorable short-term price behavior. | No. A bullish chart does not repair a deteriorating business or automatically justify valuation. |
| Best combined use | Build the underlying investment thesis. | Add a separate timing and market-behavior layer after the company thesis is understood. |
Common Stock Analysis Mistakes
| Common Mistake | Why It Weakens the Analysis | Better Check |
|---|---|---|
| Starting and ending with the stock chart | Price behavior does not show the company’s financial condition or valuation by itself. | Test the business and financial evidence separately. |
| Buying the story | A strong theme can exist without attractive company economics. | Connect the narrative to revenue, margins, cash flow, competitive position, and valuation. |
| Using one growth number | Revenue growth alone does not show per-share economics or cash generation. | Trace growth through margins, EPS, cash flow, and share count. |
| Calling a low multiple cheap | The multiple can reflect declining earnings, financial pressure, or structural risk. | Understand the denominator and why the market assigns the multiple. |
| Calling a high multiple expensive automatically | Durable growth and business quality can support a premium valuation. | Test what future assumptions are required to justify the premium. |
| Ignoring the balance sheet | Revenue and earnings can look strong while leverage or liquidity deteriorates. | Review debt, cash, liabilities, maturities, and financial flexibility. |
| Building only an upside case | The thesis becomes difficult to falsify when risks are added only after something goes wrong. | Define thesis breakers before reaching the conclusion. |
| Treating a historical case as a current recommendation | Company financials, valuation, price structure, and industry conditions change over time. | Use historical examples to study process, then rebuild the current analysis from current evidence. |
What Good Stock Analysis Can and Cannot Do
| Can Help | Cannot Prove |
|---|---|
| Clarify how the company makes money. | That future revenue will grow as expected. |
| Measure profitability, financial strength, and cash generation. | That current operating performance will remain durable. |
| Compare valuation with growth and business quality. | One exact intrinsic value or future share price. |
| Identify risks and thesis breakers. | That all important future risks have been identified. |
| Organize evidence into a repeatable process. | That the investment will generate a positive return. |
Limitations of Stock Analysis
Stock analysis depends on incomplete information and assumptions about the future. Financial statements describe reported periods, management guidance can change, competitive conditions evolve, and valuation depends on expectations that cannot be known with certainty.
Good research can reduce avoidable errors, but it cannot remove uncertainty. A company can execute well while its stock underperforms because the valuation was too demanding, and a weak company can rise temporarily because expectations, liquidity, or market sentiment change.
The practical objective is therefore not to produce certainty. It is to understand the business, test the evidence, identify the assumptions behind valuation, define what could break the thesis, and know which information should be reviewed when the situation changes.