Operating leverage describes how a company’s fixed-cost structure can cause operating income to change faster than revenue. When a business has costs that do not move quickly with sales, each additional dollar of revenue can have a larger effect on operating profit after the fixed cost base is covered.
Operating leverage connects revenue growth, cost behavior, and margin sensitivity. It is not a verdict on business quality by itself. High operating leverage can improve margins when revenue rises, but it can also pressure operating income when revenue falls or when the fixed cost base grows ahead of demand.
What Operating Leverage Means
Operating leverage measures the sensitivity of operating income to changes in revenue. A company with meaningful fixed operating costs may show a larger percentage change in operating income than in sales because part of the cost base is already in place.
The mechanism starts with cost structure. Fixed costs, such as certain salaries, rent, platform costs, depreciation, or support infrastructure, may not rise in direct proportion to revenue in the short run. Variable costs, such as direct materials, commissions, or usage-based costs, tend to move more closely with sales.
For investor analysis, the useful test is whether the observed profit sensitivity is durable, understandable, and supported by the company’s disclosures.
Operating Leverage Formula
The most common measure is the degree of operating leverage, often shortened to DOL:
Degree of operating leverage = percentage change in operating income ÷ percentage change in revenue
If revenue rises by 10% and operating income rises by 25%, the degree of operating leverage is 2.5. In plain language, operating income changed 2.5 times as much as revenue during that period.
The formula should be read as a diagnostic ratio, not as a stable law. It depends on the period measured, the starting margin base, cost classification, and unusual expenses. Because operating income usually comes from the income statement, the calculation is stronger when recurring operating activity is separated from temporary distortions.
Fixed Costs, Variable Costs, and Margin Sensitivity
Operating leverage exists because fixed costs can create profit amplification. Once a company covers a fixed cost base, additional revenue may contribute more heavily to operating income because those fixed costs do not need to be rebuilt for every unit of sales.
A more variable cost structure behaves differently. If costs rise almost dollar for dollar with revenue, operating income may grow more steadily but with less amplification. That can reduce upside sensitivity, but it can also reduce downside pressure when sales weaken.
| Cost structure | Revenue rises | Revenue falls | Investor interpretation |
|---|---|---|---|
| Higher fixed-cost base | Operating income may rise faster than revenue | Operating income may fall faster than revenue | More sensitivity to volume, capacity use, and margin base |
| Higher variable-cost base | Operating income may rise more gradually | Operating income may be less exposed to unused fixed capacity | Less amplification, but often less fixed-cost pressure |
This is why operating leverage should be interpreted together with operating margin. Operating margin shows the current profitability level, while operating leverage shows how sensitive that profitability may be to changes in revenue.
High vs Low Operating Leverage
High operating leverage usually means operating income is more sensitive to revenue changes. Low operating leverage usually means operating income moves more closely with revenue because a larger share of costs varies with sales.
| Feature | High operating leverage | Low operating leverage |
|---|---|---|
| Cost base | More fixed costs relative to variable costs | More costs move with revenue |
| Upside case | Revenue growth may produce faster operating income growth | Profit growth may be steadier but less amplified |
| Downside case | Revenue weakness may compress profit quickly | Cost flexibility may soften the operating income decline |
| Best use | Testing earnings sensitivity and margin expansion potential | Testing cost flexibility and resilience under weaker demand |
| Main risk | Reading upside sensitivity as automatic business quality | Ignoring that lower sensitivity may come with lower margin potential |
Neither structure is automatically better. The right interpretation depends on demand stability, pricing power, cost flexibility, balance sheet pressure, competitive position, and the stage of the business cycle.
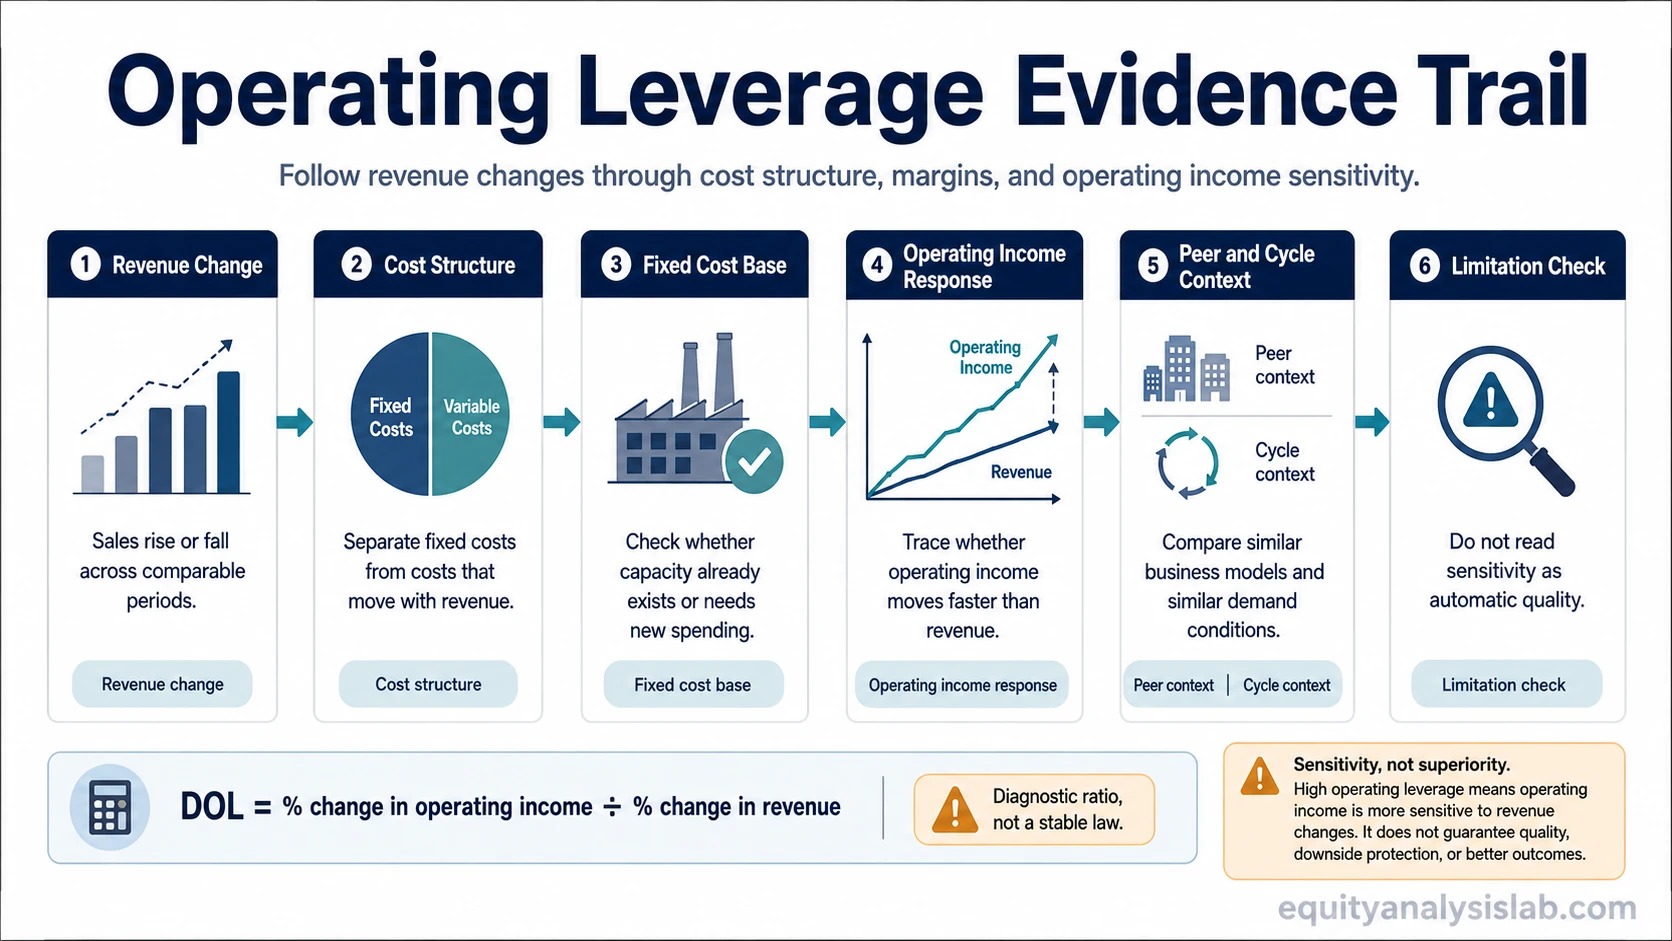
Operating Leverage Evidence Trail
An investor can treat operating leverage as an evidence trail rather than a single formula. The goal is to trace whether revenue changes are flowing through the cost base into operating income in a way that is repeatable and understandable.
| Evidence point | What to check | Why it matters | How it can mislead |
|---|---|---|---|
| Revenue change | Sales growth or decline across comparable periods | Starts the sensitivity chain | One-time demand shifts can distort the ratio |
| Operating income change | EBIT or operating income movement | Shows the profit response to revenue | Restructuring charges, one-time expenses, or reversals can distort the signal |
| Fixed cost base | Costs that do not move quickly with revenue | Explains why profit can amplify | Fixed costs may become variable over a longer period |
| Margin base | Starting operating margin and contribution margin context | Changes how large percentage movements should be read | A low margin base can exaggerate percentage changes |
| Peer set | Companies with similar business models and cost structures | Prevents weak comparisons | Different cost structures can make peer comparisons misleading |
| Cycle point | Expansion, slowdown, recovery, or demand shock | Shows whether sensitivity is structural or cyclical | A cyclical rebound can look like durable operating leverage |
| Disclosure quality | Cost classification, segment detail, and recurring expense clarity | Determines how reliable the calculation is | Public disclosures may not separate fixed and variable costs cleanly |
Illustrative Operating Leverage Scenario
Consider a company that has already built the staff, software infrastructure, facilities, and administrative base needed to support a higher revenue level. Revenue then rises because existing capacity is used more fully, while the fixed part of operating expenses changes only modestly.
The first read is tempting: operating income grows faster than revenue, so the business appears to have strong operating leverage. That read is incomplete until the investor checks what caused the revenue growth, whether costs were temporarily held down, and whether the same fixed-cost base can support future demand.
The stronger case appears when revenue growth is recurring, pricing remains stable, operating expenses are not being artificially delayed, and margins expand without weakening product quality or customer support. The weaker case appears when revenue growth is temporary, costs are postponed, or a new fixed-cost buildout is needed before the next stage of growth.
How Investors Interpret Operating Leverage
Operating leverage helps investors understand how much of a company’s earnings growth may come from revenue flowing through an existing cost base. It is especially useful when a company is moving from underused capacity toward higher utilization, or when a platform, factory, distribution network, or service infrastructure can support more revenue without equivalent cost growth.
The concept also helps separate growth quality from growth quantity. Revenue growth alone does not show how much profit the business can keep. Operating leverage asks whether incremental revenue turns into incremental operating income, and whether that relationship is likely to persist.
Peer comparison matters. A company can show better operating leverage than a peer because its cost structure is more scalable, but it can also look better because the period chosen was more favorable. A clean comparison should use similar business models, similar accounting treatment, and similar cycle points.
Cash conversion is the next check after accounting profit sensitivity. Operating leverage can improve operating income while cash generation still disappoints if working capital, capital spending, or collection timing absorbs the benefit. When that issue matters, the next layer is operating cash flow.
When Operating Leverage Can Mislead
Operating leverage can give a false comfort signal when the calculation captures a temporary period rather than a durable cost-structure relationship.
- Cost classification is unclear: Investors may not be able to separate fixed and variable operating costs cleanly from public disclosures.
- The starting margin base is low: Small operating income changes can create large percentage moves that overstate the economic signal.
- Revenue is cyclical: A rebound from weak demand can make operating leverage look stronger than it is across a full cycle.
- Costs are delayed: Margins may expand temporarily if hiring, maintenance, product investment, or support spending is postponed.
- The peer set is mismatched: Comparing businesses with different cost structures can create a false high or low operating leverage read.
- Financial leverage is mixed into the interpretation: Operating leverage concerns operating income sensitivity before financing effects, while financial leverage concerns debt and interest obligations.
The safest interpretation is conditional. Operating leverage can help explain earnings sensitivity, but it does not prove business quality, valuation upside, or future margin expansion.
Operating Leverage and Related Concepts
Operating leverage overlaps with several business model and financial concepts, but it should not replace them.
| Concept | Core question | How it differs from operating leverage |
|---|---|---|
| Capital intensity | How much asset and reinvestment support does growth require? | Capital intensity focuses on assets and reinvestment needs, while operating leverage focuses on operating income sensitivity through cost structure. |
| Economies of scale | Does unit cost improve as the business gets larger? | Economies of scale can support operating leverage, but operating leverage is the earnings sensitivity created by the cost base. |
| Recurring revenue | How stable and repeatable is the revenue base? | Recurring revenue can make sales more predictable, while operating leverage determines how revenue changes flow into operating income. |
| Financial leverage | How much debt or financing obligation affects equity returns? | Financial leverage sits below operating income through interest and financing structure. Operating leverage sits inside the operating model. |
FAQ
What is operating leverage?
Operating leverage is the sensitivity of operating income to changes in revenue. It usually comes from a cost structure with fixed costs that do not move directly with sales in the short run.
How do you calculate operating leverage?
A common calculation is the percentage change in operating income divided by the percentage change in revenue. The result shows how strongly operating income changed relative to sales during the measured period.
Is high operating leverage good or bad?
High operating leverage is neither automatically good nor bad. It can amplify profit growth when revenue rises, but it can also amplify profit declines when revenue falls or fixed costs become too heavy.
What is the difference between operating leverage and financial leverage?
Operating leverage comes from fixed operating costs and affects operating income. Financial leverage comes from debt or financing structure and affects earnings after interest and financing costs.
Why can operating leverage mislead investors?
It can mislead when the period is unusual, cost classification is unclear, the margin base is very low, revenue is cyclical, or peer comparisons use businesses with different cost structures.